

Consider a checkout platform at two in the morning. The model-call panel has read zero since Tuesday's package upgrade, although the assistant answers as well as ever. The trace for order 42 ends at the queue, and the worker's half sits in a second trace that nobody has found. Twenty people have the operations dashboard open, and the database is busier answering it than taking payments. The tracing pipeline is dropping spans because the collector is slow, and nothing alerts on that.
None of these is an application bug. Each is telemetry doing what it was built to do, and the question that night asks is the one engineers arrive with: what should a .NET service emit, what does that cost, and will it still say something true when someone needs it? Observability is several mechanisms with different costs and different ways to fail, so this guide draws the map. Six deep dives on DevInside each measured one part of it with a solution you can run; here their numbers sit side by side, and every section ends with the article to read next.
- Telemetry costs most before anyone decides to keep it. C# builds an attribute's value before the sampler is asked, so an unguarded payload took a 10% sampled service from 9,874 to 12,462 bytes per request, almost the 12,662 of tracing everything. Latency barely moved; memory and CPU did.
- Every telemetry pipeline loses data under pressure, and so it should: the batch processor dropped 404 and 1,720 of 10,000 spans without slowing a request. What hurts is not counting the loss, and monitoring that becomes the workload: twenty dashboards took a database from 1,579 to 186 lookups a second.
- Telemetry is a schema you only partly own. A package upgrade renamed
gen_ai.systemand zeroed a panel without an error; old readers of JSON, Protocol Buffers and MessagePack read 1,500 µs as 1,500 ms. Contract tests over exported data caught 10 of 11 seeded changes. - One request reads as one trace only if context crosses the queue in the message, every retry has its own span, and business identity lives in a status row and on spans, never on a metric: 3,000 conversation ids hit the SDK's 2,000-set limit.
Four records answer four questions, and only one of them is telemetry-proof
When order 42 fails once and then succeeds, four different questions get asked about it, and each is answered by a different record with different guarantees. The trade-offs in the rest of this guide follow from that.
| Record | Answers | When the trace is sampled out |
|---|---|---|
| Status row | What happened to order 42, and is it done? | Unaffected: it is written by the application, not by telemetry |
| Metrics | How many, how often, how slow, for all traffic? | Unaffected: every request is counted, with bounded tags |
| Logs | What did each service say about this request? | Kept, and joined by trace id if context was propagated |
| Traces | Where did the time go, and what caused what? | Gone for this request: only kept traces exist |
In the order-trace solution, with the sampling ratio at zero, the four processes exported zero spans, yet the customer still read completed, 2 attempts from the status endpoint and the five application log records still shared one trace id. Identities follow the same split. The order id says which customer's order, the operation id which execution, the attempt number which try, and the trace and span ids how one piece of work caused another. Only the last is diagnostic, may be incomplete by design, and must never key the status record.
Every span passes four decisions before anyone reads it
Where along the pipeline can a decision save work, and where can it break a reader? The figure follows the telemetry of one checkout request from the line of code that creates it to the dashboard that reads it.
Each decision saves only the work to its right. The status row never depends on any of them.
- The whole cast. Four decisions inside the process, three readers outside it, and one record the application writes on its own: the order's status row.
- Your code runs first, so whatever it builds is paid for on every request. A 1.5 KB basket serialized for a span attribute costs about 3.1 KB per checkout even with no tracer at all.
- The sampler keeps one request in ten. It saves only the work to its right; a dropped root span is still a non-null
Activity, so?.SetTagstill builds the payload. - The trace continues in the next process only if the context travels with the request: HTTP instrumentation writes
traceparentfor you, a queue message needs your code to inject it. - The batch queue is full because the exporter is slow. New spans are dropped on the spot and counted as
queue_full: 1,720 of 10,000 in one load run, and no request waited. - The exporter sends bytes the backend stores, and the dashboard finds them by attribute name. After an upgrade renamed
gen_ai.system, the panel filtering on it read 0 without an error. - The status row passed none of these decisions. With every span sampled out, the customer still read
completed, 2 attempts, because the application wrote it.
Stages as implemented by OpenTelemetry .NET 1.21.0 (TracerProviderSdk, BatchExportProcessor defaults). Numbers from the observer-effect, telemetry-contract and order-trace solutions on .NET 11.0.0.
Two rules come out of the map. A decision can only avoid the work to its right: a head sampler saves the export and the backend, not the payload your code already built, and a tail sampler in a collector saves storage after the service has paid for everything. And a reader finds only what arrived with the names it expects: between the exporter and the dashboard everything is a schema, and schemas drift.
Telemetry costs most before the sampler decides
When code calls ActivitySource.StartActivity, every registered listener is asked what it wants, and the OpenTelemetry SDK maps its sampler's answer onto ActivitySamplingResult. A dropped root span, or one with a remote parent, becomes PropagationData: the activity exists so that its trace id can reach downstream services, but nobody wants its attributes. In ASP.NET Core, the request's server span is exactly such a root, so Activity.Current in a handler is never null under a dropping sampler.
That turns the most common enrichment line into a trap. In the observer-effect lab, attaching a basket to a span allocated 3,592 bytes per checkout under AlwaysOff when written eagerly or with ?., and 416 bytes, the propagation-only activity itself, when guarded by IsAllDataRequested. Logging has the same shape: a source-generated LoggerMessage method checks IsEnabled before formatting, but C# evaluates the argument before the call, so a disabled Debug line still built 3,096 bytes.
What does that cost a whole service? The lab ran one checkout API at seven telemetry levels, 1,000 requests a second, exporting over OTLP to an Aspire dashboard.
An unguarded attribute at 10% sampling allocates almost as much as tracing everything
| Telemetry level | Bytes per request |
|---|---|
| None | 7577 |
| Metrics | 9520 |
| Logs | 9724 |
| Traces 10%, guarded | 9874 |
| All three, guarded | 10263 |
| Traces 10%, ?.SetTag | 12462 |
| Traces 100% | 12662 |
- Bytes allocated per request at each level. The service itself costs 7,577 bytes; each signal adds about 2 KB, and the three together add 2.7 KB.
- Same sampler, same 10%. The guarded version built the basket for about 1,000 requests;
Activity.Current?.SetTagbuilt it for all 10,000 and kept only a tenth. - So the unguarded 10% run allocated within 200 bytes of tracing every request, while exporting a tenth of the spans.
Measured in the observer-effect solution: Checkout.Api limited to 4 processors, 1,000 requests/s for 10 s after a 3 s warm-up, OpenTelemetry 1.21.0 exporting to the standalone Aspire dashboard 13.6.5 in Docker; .NET 11.0.0, Windows Server 2022, AMD EPYC 7502P, shared machine. Round 1 shown; allocations differed by less than 1% between rounds.
Latency hid all of it. The p50 stayed between 0.25 and 0.35 ms at every level, and p99 varied more between rounds than between levels. CPU per request more than doubled, from 130 to 136 µs with no telemetry to 288 to 323 µs with all three signals. At moderate load the observer effect is a capacity and GC question first, a latency question later.
Instrumentation nobody listens to is close to free, because libraries check before they work. In the telemetry-contract benchmark, wrapping a chat client with UseOpenTelemetry while nobody listened moved the p50 from 0.3 to 0.4 µs per call. Full metrics and traces added 1.3 µs and about 1.2 KB per model call, noise next to a model round trip. Capturing message content added 3.1 µs and redacting it another 1.9 µs; the reason to keep it off is what those bytes contain.
Read this next: The observer effect: a small .NET telemetry lab measures the three ways to attach a payload under four sampler configurations, runs the service at seven telemetry levels and shows the request span in the Visual Studio debugger, unsampled and still non-null.
A full pipeline loses something, and you choose what
Exporting on the request thread would make every request wait for the network: with SimpleActivityExportProcessor and a 20 ms exporter, ending 40 spans took 821 ms on the calling thread. The OTLP default, BatchActivityExportProcessor, puts ended spans in a bounded buffer that a background worker drains: 2,048 spans, a 5,000 ms schedule, batches of up to 512 (BatchExportProcessor.cs at 1.21.0). When the buffer is full, the span is dropped.
The load runs met that limit. At 100% sampling, with a 1.5 KB basket on every span and a dashboard capped at one CPU, the SDK dropped 404 spans in one round and 1,720 in the other, out of 10,000, and the requests did not notice. In the lab's stalled-exporter scenario, a queue of 8 exported spans 1 to 12 and dropped 13 to 40, while the request thread ended its 36 spans in 0.16 ms. The default queue buys seconds, not minutes: by the deep dive's arithmetic, a process ending 500 spans a second fills it in about 4 seconds.
Dropping is the right policy for diagnostic data. The SQL monitoring lab ran the three policies a bounded channel offers against one hung exporter: TryWrite loses the newest records, FullMode.DropOldest the oldest, and awaiting WriteAsync loses nothing by making the producers, in a service the requests, wait. What is wrong is not knowing which one you have. Since 1.18.0 the SDK reports drops in otel.sdk.processor.span.processed with error.type=queue_full on the otel.sdk.experimental meter; export it through a path that does not depend on the stalled trace exporter, and alert on it.
The same lab shows that monitoring is a workload, and it peaks during incidents. A status tile that returned four rows read all 546 pages of the payments table on every refresh. With twenty viewers each querying SQL Server 2025 once a second, business lookups fell from 1,579 to 186 a second and their p99 rose from 17.5 to 105 ms; with one server-side refresher sharing a snapshot, they ran at 1,643 a second. Every monitor has a per-call cost, multiplied by its refresh rate and by the number of people watching.
Read this next: When monitoring becomes the workload measures each dashboard tile in logical reads, shows a waiting count query blocking an unrelated writer, and builds the shared snapshot that reports its own age.
Telemetry is a schema, and it ages on someone else's schedule
Every consumer of telemetry, a panel, an alert, a cost report, depends on names, units, attribute sets and populations. That is a schema, and its failures are quiet. A query that filters on an attribute nobody writes any more matches nothing. A reader that skips a field it does not know reads the value with the old meaning.
The telemetry-formats deep dive shows the second case byte by byte. Version 2 of a latency sample adds a unit, and the producer starts sending 1,500 µs. Version 1 readers of JSON with default options, of Protocol Buffers and of a MessagePack array all read 1,500 as milliseconds, without an exception: 1.5 s on the chart. Changing int32 to sint32 read 1,500 as 750; renumbering the field read 0. Only readers that compared a version, or rejected unknown members with JsonUnmappedMemberHandling.Disallow, refused the record, and that is what you want: a refusal goes to a dead-letter queue, a wrong value goes to the dashboard. So upgrade readers first, producers second, and give a new unit a new field.
Format size matters less than it looks once the transport compresses. For 128 events, positional binary took 3,554 bytes, MessagePack 3,473, Protocol Buffers 3,899, JSON 10,055 and OTLP log records 15,861; after Brotli at quality 4, all fell to 649 to 1,133 bytes. CPU follows each format's object graph: serializing the batch took a median of 3.5 µs as binary and 107.8 µs as OTLP. At 10,000 events a second that is about 0.3 against 8.4 ms of CPU per second, the price of a format every collector reads without your code.
The silent rename is what the telemetry-contract deep dive measured on an AI platform. The same assistant, compiled against Microsoft.Extensions.AI 9.8.0 and 11.0.0, made the same 16 model calls. On 11.0.0 the provider attribute became gen_ai.provider.name, server.address went from a URL to a host, the token unit became {token}, and one token point became two. A panel filtering on gen_ai.system read 16 calls, then 0; an adapter that maps every known name into one vocabulary read 16 both times. The GenAI conventions are still in Development status, and their main branch already renames the token metric again.
Written down as ten rules over exported data (known instruments, units, allowlisted attributes, closed value sets, populations, span parents, no personal data in content), the contract caught 10 of 11 seeded changes, including the old library's output. The miss, input and output tokens swapped by a provider adapter, is a wrong value in the right place: a schema checks shape, not truth.
Read this next: Telemetry event formats: bytes, CPU and schema compatibility derives golden bytes by hand for five encodings and tests which schema changes each reader notices; Telemetry is a schema: one contract for a .NET AI platform diffs the two library versions, tests the contract against seeded changes and reads OpenTelemetryChatClient and the SDK's AggregatorStore to explain both.
Sampling decides which traces exist; cardinality decides whether a metric survives
The two volume controls work on different signals and fail differently. A sampler removes whole traces, so it must be consistent across services: ParentBasedSampler(TraceIdRatioBasedSampler) lets the first service decide and every later one follow the flag in traceparent, which only works if the context, sampled or not, crosses every hop. A head sampler cannot keep "every trace that failed", because it decides before the outcome exists; a tail sampler in the collector can, after the service has built and sent every candidate span. A sampling key such as a customer tier goes to StartActivity as a cheap tag, where the SDK hands it to the sampler.
Metrics are never sampled, which is why they can count all traffic, and why an identifier destroys them: every distinct attribute combination is a separate series. In the telemetry-contract run, 3,000 answers with the conversation id as a metric attribute produced 2,000 points and folded the other 1,000 measurements into one overflow point, after which only the metric's total can be trusted. A lower CardinalityLimit only moved the cliff. A view with TagKeys repaired the metric to 4 points, but its exemplars still carried the conversation id. With the id kept on the span and ExemplarFilterType.TraceBased, the metric had 4 points and 20 exemplars, each pointing to the trace of a real question.
Two more measurements are about what a number means. Model calls are attempts and user questions are operations: 16 calls and 12 questions in the same run gave a "success rate" of 62.5% or 83.3% depending on which population a panel counted. And a histogram is only as precise as its buckets: twelve answers between 0.4 and 4.8 s, recorded in seconds without bucket advice, all landed in the SDK's default first bucket, (0, 5].
Read this next: the cardinality, population and bucket measurements are all in the telemetry contract deep dive; sampling keys, head against tail sampling and the propagation-only root span are in the observer-effect lab.
How one request reads across HTTP, a queue and retries
A trace is a tree of spans sharing one trace id. Within one process, Activity.Current flows with async code and parents come for free. Between processes, the context travels as text in the W3C traceparent header: version, trace id, the sending span's id, and flags, where bit 0x01 means sampled. Which hops carry it on their own?
HTTP carries the trace by itself. The queue and the retry loop need your code.
- The client's HTTP instrumentation writes
traceparent, and the API's server span becomes its child. Nothing in your code is involved in this hop. - The API records
acceptedand publishes the order. Only the message crosses the queue, so your code injects the context into its headers and answers 202. - The worker extracts the context from the headers and starts the consumer span with it as an explicit parent, never trusting whatever
Activity.Currentholds on its thread. - Attempt 1 gets a 503. It has its own span, marked Error, and a warning log with the same trace id.
- The backoff is an event on the consumer span, and attempt 2 is a new sibling span that succeeds. The failed attempt stays failed in the trace.
- The worker reports
completed, 2 attemptsto the API, which updates the status row: the record that answers the customer. - Run again with the sampling ratio at zero: no spans exist, yet the unsampled context crossed the queue, and all five log records share one trace id.
The order-trace solution: Aspire 13.6.5 AppHost, RabbitMQ in Docker, OpenTelemetry .NET 1.21.0 on .NET 11.0.0. With everything sampled, the run exported 13 spans from four services under one trace id.
The order-trace deep dive then broke the instrumentation on purpose, one defect per run, and the business outcome was identical every time. When the producer forgot to inject, the same 13 spans formed two traces split exactly at the queue, and each half looked complete. When it injected only from the producer span, which is null in an unsampled trace, the worker's logs got a different trace id than the API's; falling back to Activity.Current kept one. A test that asserts the consumer span's parent across the real broker catches the split in CI.
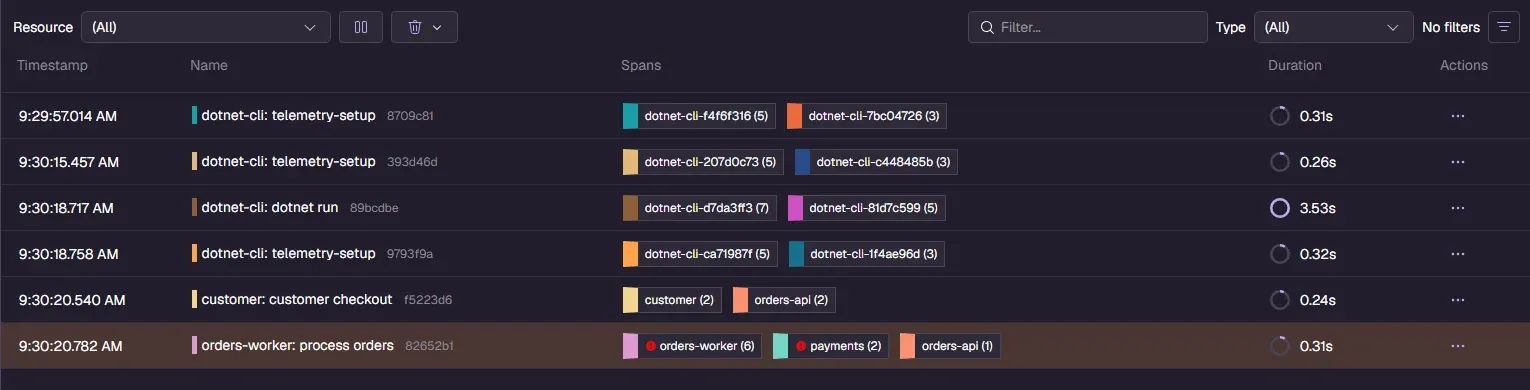
Retries are where traces most often lie. The Aspire service defaults add a standard resilience handler to every HttpClient; left on the payments client, it retried the 503 inside one call. One attempt span of 2,442 ms held both HTTP calls, the worker logged no warning, and the customer read completed, 1 attempts. With one retry owner and a span per attempt, a provider that always failed produced 16 spans, 10 in Error, and the customer read failed, 3 attempts. A consumer that handles a batch from many producers uses span links instead of a parent.
A trace ends when the request does; the story of the data does not. The traceable-path deep dive keeps the same discipline in PostgreSQL 18: every attempt is recorded before the retry hides it, and freshness is measured from the source event to the screen. A version accepted on its first attempt reached the dashboard in 560.2 ms at p50; a retried one took 1,522.3 ms at p99, and only the attempt history explained why its Succeeded status row was late.
Read this next: An observable .NET service before the first incident builds the four-process system with Aspire, carries the context across RabbitMQ and shows each defect in the Aspire dashboard; A traceable path from ingestion to insight keeps attempt history, lineage and freshness for a number on a screen.
The measured numbers, side by side
Every number below is quoted from the published deep dive in the first column, which takes it from its solution's results/ folder. The .NET runs used .NET 11.0.0 on Windows Server 2022 x64 with an AMD EPYC 7502P (64 logical processors), a shared machine; databases ran in capped Docker containers on the same host. Bytes and counts are exact; times move between runs, so compare within a row, not across articles.
| Deep dive | What was measured | Result |
|---|---|---|
| Observer effect | Bytes per checkout under AlwaysOff: eager or ?.SetTag against guarded | 3,592 B against 416 B |
| Observer effect | Bytes per request at 1,000 requests/s: none, traces 10% guarded, unguarded, traces 100% | 7,577; 9,874; 12,462; 12,662 B |
| Observer effect | p50 across all seven levels; CPU per request, none against all three signals | 0.25 to 0.35 ms; 130 to 136 against 288 to 323 µs |
| Observer effect | Spans dropped as queue_full at 100% sampling, two rounds | 404 and 1,720 of 10,000 |
| Event formats | 128 events uncompressed: MessagePack, binary, Protocol Buffers, JSON, OTLP logs | 3,473; 3,554; 3,899; 10,055; 15,861 B |
| Event formats | Same batches after Brotli quality 4 | 649 to 1,133 B |
| Event formats | Serialize 128 events, median, binary against OTLP; bytes allocated to read them back | 3.5 against 107.8 µs; 10,264 against 138,362 B |
| Event formats | V1 readers given a V2 sample of 1,500 µs: JSON default, Protocol Buffers, MessagePack | 1,500, read as ms, no error |
| Order trace | One order, everything sampled | 13 spans, 4 services, 1 trace id |
| Order trace | Producer forgets to inject context | Same 13 spans in 2 traces |
| Order trace | Sampling ratio 0: spans exported; trace ids in logs, without and with the fallback | 0 spans; 2 against 1 |
| Order trace | Standard resilience handler left on: one attempt span; attempts the customer saw | 2,442 ms; 1 instead of 2 |
| Telemetry contract | Panel filtering on gen_ai.system, 9.8.0 against 11.0.0; adapter | 16 against 0; 16 both |
| Telemetry contract | Seeded changes caught by the contract rules | 10 of 11 |
| Telemetry contract | Successful model calls against answered questions, same run | 62.5% against 83.3% |
| Telemetry contract | 3,000 conversation ids on a metric: points exported, measurements in overflow | 2,000; 1,000 |
| Telemetry contract | p50 per model call: bare, nobody listening, metrics and traces, plus content, plus redaction | 0.3; 0.4; 1.6; 4.7; 6.6 µs |
| Telemetry contract | Spans with an e-mail or phone number, content on, without and with redaction | 5 of 16 against 0 of 16 |
| Monitoring workload | Lookups/s and p99: no dashboard, 20 viewers each querying, shared snapshot | 1,579 and 17.5 ms; 186 and 105 ms; 1,643 and 13.8 ms |
| Traceable path | Order to screen: p50 first attempt, p99 retried | 560.2 ms; 1,522.3 ms |
Read down the result column and the shape of this guide appears in the data: the large costs were in work done before any decision (payloads built for dropped spans, a dashboard query per viewer), the large failures were silent (a rename, an unknown field, a split trace, a retry inside a retry), and none of them changed whether the order completed.
Read this next: one deep dive per question
- "What does tracing cost us, and is the sampler saving anything?" Read The observer effect. It runs a checkout API at seven telemetry levels and a batch-processor lab; the key finding is that a dropped root span is not null, so only an
IsAllDataRequestedguard skips the payload. - "JSON, Protocol Buffers or OTLP, and what happens when we change a field?" Read Telemetry event formats. It follows one record through five encodings with hand-derived golden bytes and a schema-change matrix; most old readers accepted the new record and held the wrong value.
- "How do we follow one order across HTTP, a queue and retries?" Read An observable .NET service before the first incident. It runs four processes and RabbitMQ under Aspire with switches that break propagation, sampling and retries; the outcome never changed, the telemetry's story changed every time.
- "A package upgrade broke our dashboards. What may go on a metric?" Read Telemetry is a schema. It diffs two Microsoft.Extensions.AI versions, tests a written contract against seeded changes and measures cardinality and prompt redaction; identities belong on spans, reached through exemplars.
- "Is our monitoring hurting the database?" Read When monitoring becomes the workload. It measures dashboard tiles, blocking chains, Query Store and Extended Events polls on SQL Server 2025; one shared snapshot made the database cost independent of the number of viewers.
- "Why did this number change, and how old is it on screen?" Read A traceable path from ingestion to insight. It keeps lineage, attempt history and freshness for one total in PostgreSQL 18; the publication interval set the median, retries set the tail.
If the telemetry points at allocations or a slow path rather than at the pipeline itself, the memory and allocations guide and a measurement contract for .NET are the next steps.
Decision guide: from symptom to first move
| What you see | First move | What not to do yet |
|---|---|---|
| Allocations or CPU per request rise with tracing on | Build optional detail inside IsAllDataRequested (also for Activity.Current) and IsEnabled; measure bytes and CPU per request at a fixed rate | Lower the sampling ratio and expect the payload cost to fall |
| Gaps in traces when the collector is slow | Export otel.sdk.processor.span.processed and alert on queue_full; sample earlier | Raise MaxQueueSize to hide drops, or export on the request thread |
| Dashboards slow the database during incidents | One server-side refresher with a snapshot and its age; a lock timeout on every monitor | Add NOLOCK, or only lower each browser's refresh rate |
| A panel reads zero after a package upgrade | Read through one adapter that maps old and new names; alert on unclassified points; test the exported shape | Edit the panel to the new name only |
| A unit or field of an event must change | New field or new version; strict readers that refuse what they do not know; readers upgraded first | Rely on tolerant default deserialization |
| A trace splits at a queue | Inject on send with the fallback to Activity.Current; extract and pass an explicit parent or link | Rely on ambient context in the worker |
| A retried call looks green | One span per attempt, backoff as an event, exactly one layer that retries | Stack a resilience handler under your own loop |
| A metric overflows or its series explode | Identities on spans, exemplars with TraceBased; bounded, closed value sets on metrics | Lower the cardinality limit, or rely on a view to remove personal data |
| Support asks what happened to one order | A status row keyed by operation id, written by the application | Use the trace id as the status key |
Checklist
- Every attribute or log argument that serializes, formats or queries is built behind
IsAllDataRequestedorIsEnabled. - Telemetry overhead is measured as bytes and CPU per request at a fixed rate, with the sampler you run in production.
- Exports go through the batch processor, and dropped spans are counted, exported independently and alerted on.
- Every dashboard tile has a written question and a per-call cost; database cost does not grow with the number of viewers.
- Every numeric field has a unit in the schema; readers check versions and reject what they cannot interpret; readers are upgraded before producers.
- Each instrumentation package pin is recorded with the semantic-convention version it implements, and a test compares exported shape with the approved one.
- Metric attributes come from closed, bounded sets; identities live on spans and are reached through exemplars.
- Every queue send injects context, every consumer extracts it as an explicit parent or link, and a test checks the parent across the real broker.
- Each retry attempt has its own span, failed attempts keep their Error status, and only one layer retries.
- Order status lives in a record the application writes, so it survives sampling, drops and retention.
Further reading
- W3C Trace Context: the
traceparentandtracestateheaders. - .NET distributed tracing instrumentation:
ActivitySource,IsAllDataRequestedand optional tags. - OpenTelemetry sampling concepts: head and tail sampling.
- BatchExportProcessor.cs at OpenTelemetry .NET 1.21.0: queue defaults and the drop path.
- OpenTelemetry .NET metrics best practices: cardinality limits, overflow and exemplars.
- Semantic conventions for messaging spans: producer and consumer spans, parents and links.
- OpenTelemetry GenAI semantic conventions: the vocabulary AI telemetry is moving to.
- Protocol Buffers: updating a message type: which field changes stay compatible.