The Observer Effect: A Small .NET Telemetry Lab
Telemetry has measurable CPU, allocation and storage costs that must be balanced against diagnostic value.
Explore the mechanism ↓
Reading tools Listen or translate
Read aloud
Uses an installed voice on your device.
Translate article
Machine translation. Code and evidence notes stay in English.
Original English text.
START WITH THE MECHANISM
Interactive companion and laboratory update: 12 November 2026. The editorial date places the topic on the timeline; this current explanation and its measured evidence retain their actual preparation and execution dates.
THE FULL INVESTIGATION
The Observer Effect: A Small .NET Telemetry Lab
Dates and technology context
This is a retrospective editorial timeline. Topic context: 24 July 2025. First publicly available: 12 November 2026. Current text, visuals and laboratory revisions were prepared on 12 November 2026.
The loopback HTTP/OTLP companion, allocation observations and separate flush interval were executed in November 2026, although its .NET9/OpenTelemetry pins existed before the historical context.
A service becomes slower after an observability rollout. The dashboard contains more detail than before, yet the team cannot establish whether the rollout caused the slowdown. Traffic changed, a dependency was patched, and the deployment also included a new serializer. Every explanation sounds plausible. None has a clean comparison behind it.
That hypothetical situation captures a particular engineering embarrassment: collecting more evidence does not necessarily make a claim easier to test. The collection mechanism participates in the system it describes. Allocating a tag, serializing an event, exporting a batch and retaining a queue all consume resources. Even when each operation is small, its placement can matter more than its individual cost.
The useful question is therefore specific: what diagnostic capability does this instrumentation buy, and what does that capability cost under a declared workload? This article develops a small laboratory that makes the trade visible. The executed companion later in the article reports a bounded HTTP/OTLP experiment. The wider diagnostic-quality and outage investigations remain proposed work with their own acceptance criteria.
The proposed reproduction pins SDK 9.0.101 and runtime 9.0.0, OpenTelemetry, Hosting and OTLP exporter 1.11.2, ASP.NET Core instrumentation 1.11.1, and BenchmarkDotNet 0.14.0. Their publication dates precede the contextual date. These are historical laboratory pins; dependency restoration, compatibility and execution remain unperformed. The OpenTelemetry release record and Microsoft SDK metadata support version availability, not an overhead result.
Decide what the service promises
Begin with one ASP.NET Core endpoint and one explicit response contract. A request contains a bounded collection of synthetic records. The endpoint validates them, computes a deterministic aggregate and returns the aggregate with a request identifier. A separate fixture introduces a controlled dependency delay. Neither fixture needs a real customer database.
The distinction matters. A CPU-heavy endpoint can expose instrumentation work that a long network wait hides. A dependency-heavy endpoint can reveal whether the resulting trace helps explain a delay. One does not replace the other. An experiment that measures only the cheapest success path can make a useful monitoring configuration look unnecessarily expensive, or make an incomplete configuration look ideal.
Choose the unit of success before choosing counters. A completed HTTP response is not enough if the aggregate is wrong. A response that arrives after the caller's deadline is not operationally equivalent to a timely response. Record correct, timely completions separately from errors, cancellations and responses that miss the deadline.
The historical baseline here is .NET 9, which was released in November 2024. The proposed experiment's contextual date is July 2025. Any execution performed now must carry its actual date and exact versions. The historical frame is a way to constrain the design, not a licence to backdate a result.
Give the observer its own boundary
01 / See the idea
Two clocks, one experiment
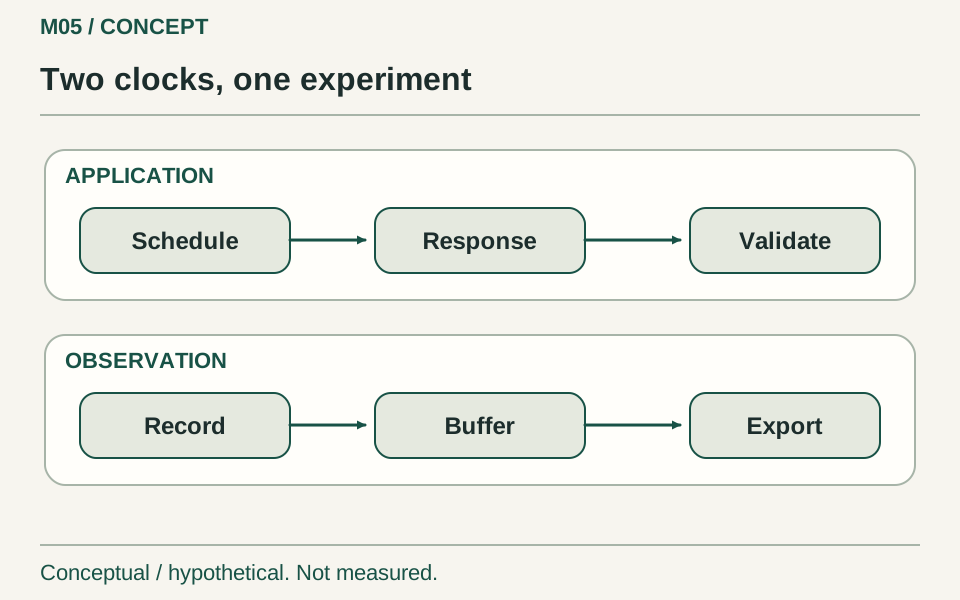
Imagine a request returning while its span still waits in an exporter queue. Client completion measures the response; telemetry drain measures remaining observation work, so neither clock should silently replace the other.
Interpretation and evidence
- End latency at client validation.
- Record telemetry drain separately.
- Include collector resource use.
Draw two paths. The application path begins when the load generator schedules a request and ends when the client validates the response. The observation path begins when instrumentation creates information and ends when that information is accepted by its destination. Those paths overlap, but their completions are different events.
A request can finish while its telemetry remains in an export queue. A benchmark that stops immediately after the last response may omit the final export work. Conversely, waiting for all telemetry before recording application latency charges the request for work its caller did not wait for. Neither convention is inherently dishonest. Hiding the convention is the problem.
Use client-observed latency for the user-facing boundary. Measure application CPU, allocations, resident memory and accepted throughput independently. Measure the collector or exporter process as another resource consumer. If the collector shares a host with the application, report both per-process usage and host pressure. Otherwise an apparently efficient application can simply have moved work into an adjacent process.
Google's monitoring guidance distinguishes externally observed behaviour from instrumentation inside the system. That distinction is useful here because the experiment needs both views, rather than relying on the telemetry under evaluation to judge itself. Google SRE, Monitoring Distributed Systems.
Compare configurations that answer different questions
The baseline should execute the same business code with instrumentation disabled. Keep the instrumentation calls in the code if disabling them is a supported configuration. Removing the calls entirely answers a different question about code generation and call overhead. Both comparisons can be useful, but give them different names.
Then introduce configurations deliberately: basic request spans, dependency spans, selected business attributes and an export destination. Change one factor at a time before testing combinations. Record the exact sampler and exporter configuration rather than labelling a run merely “OpenTelemetry enabled.” The OpenTelemetry .NET 1.0 announcement establishes the historical SDK baseline; it does not establish the cost of a particular configuration.
Attribute choice deserves its own experiment. A bounded outcome label such as accepted, rejected or cancelled serves a different purpose from a unique transaction identifier. A unique identifier can be valuable when following one incident, but grouping every metric by that identifier creates a different storage problem. Keep correlation identifiers in the appropriate diagnostic record rather than automatically promoting every field into every signal.
Also separate attribute construction from export. If an expensive description is built before the sampling decision, a low sampling rate may leave much of the application-side cost intact. The experiment should test the actual path through the code, not infer savings from the percentage of spans that eventually appear in a dashboard.
Make the run schedule resistant to convenient answers
Running the baseline once in the morning and the instrumented variant once in the afternoon is an invitation to confounding. Warm-up, neighbouring processes and changing infrastructure conditions can all become accidental members of the treatment group.
Use a fixed, recorded workload and alternate configurations in a randomized order. Warm each configuration according to the same declared rule. Retain every valid run, including runs that weaken the preferred explanation. If a run is discarded, record the exclusion reason independently of whether its result looks favourable.
Do not let the load generator conceal overload. Record when a request was intended to start as well as when it actually started. If the generator waits for the previous response before issuing the next request, slower responses may reduce offered load. The application then appears to maintain a stable latency because the experiment quietly stopped asking it to do as much work.
The following is experiment pseudocode, not an executable benchmark harness:
for configuration in randomized_run_order:
    start_isolated_application(configuration)
    warm_up_using_declared_rule()
    start_external_resource_measurement()
    schedule_identical_request_sequence()
    record_scheduled_and_actual_start_times()
    validate_every_response()
    stop_admitting_requests()
    record_application_drain_time()
    record_telemetry_drain_time_separately()
    save_manifest_and_raw_observations()
Keep each run's manifest with its observations. The manifest should identify the source revision, runtime, package versions, machine or container limits, workload seed and configuration. A chart without that manifest is a picture of an event that may never be reproducible.
Measure diagnostic value with an injected fault
02 / A concrete example
More detail must buy a decision
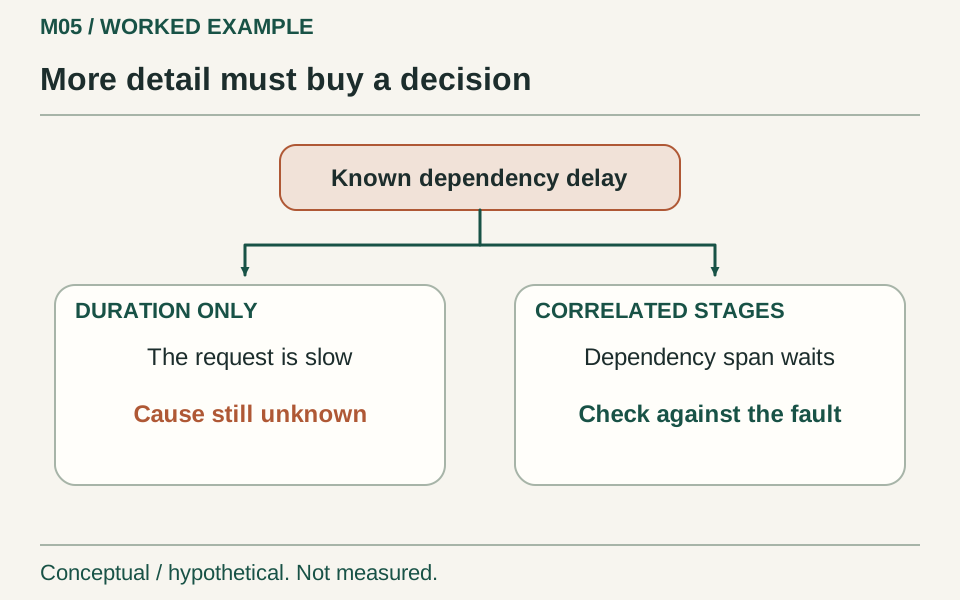
Suppose a hidden fault schedule delays a dependency. A duration alone shows a slow operation; a correlated stage trace may distinguish the dependency from application work, which a blinded reviewer must check against the injection record.
Interpretation and evidence
- Hide the injection schedule from the reviewer.
- Score the explanation, not the dashboard.
- Retain the cost of each configuration.
Overhead alone creates a misleading optimization target. Disabling all telemetry will often reduce some work, but the point of telemetry is to help make decisions that would otherwise be expensive or impossible.
Introduce a known delay in one dependency path for a declared subset of requests. In a separate scenario, cause a bounded set of validation failures. Ask a reviewer who does not know the injection schedule to identify which component changed, which requests were affected and whether the symptoms are consistent with the proposed cause.
Score the answer against the injection record. The goal is not to reward a beautiful dashboard. It is to establish whether the collected information distinguishes the intended incident from plausible alternatives. A configuration that records every successful request but omits the failure boundary may be costly and diagnostically weak.
Sampling complicates this test in useful ways. Repeatedly inject a rare fault and measure how often the evidence needed to explain it survives. Do not declare a sampling strategy adequate because one demonstration happened to retain the important trace. The relevant question is whether its failure to retain evidence is acceptable for the incident and workload being considered.
Distinguish a cost from a bottleneck
Suppose, purely as an arithmetic example, application CPU increases from 40 to 44 units under a fixed offered load. That is a ten percent relative increase in this chosen measure. It does not imply that latency increased ten percent, capacity fell ten percent, or operating cost rose ten percent. Those are separate claims requiring separate observations.
An application with spare capacity can absorb extra CPU without changing its response distribution much. Near a resource limit, the same extra work may cause a queue to grow. A small average increase can then coexist with a large change in tail latency. Test multiple load levels so the report shows where the configuration becomes consequential.
Allocation measurements need similar discipline. A microbenchmark can isolate the cost of constructing an attribute set. It cannot establish the system-wide effect of exporter buffering, network stalls and collector contention. BenchmarkDotNet's 0.14.0 release is a suitable historical reference for an isolated measurement, while the service experiment must still examine the larger boundary.
The most useful result may be a crossover rather than a winner: configuration A is inexpensive at modest load but becomes unstable when the exporter slows; configuration B uses more resources steadily but preserves a bounded failure mode. A ranking that collapses those behaviours into one score discards the decision the experiment was supposed to support.
Break the telemetry path deliberately
03 / Watch the mechanism
A full buffer forces a policy
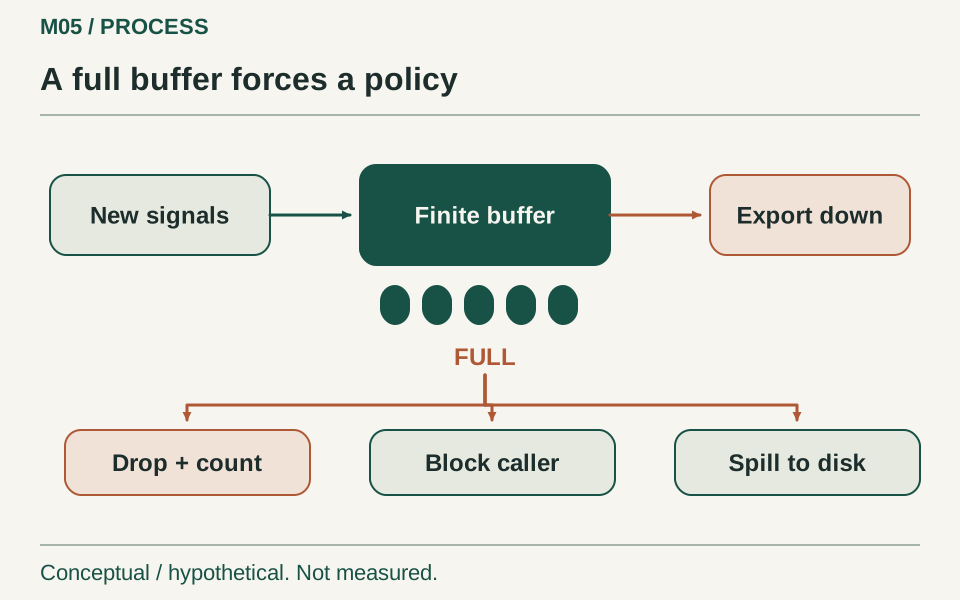
Static view. Play to see how the mechanism unfolds.
Suppose the export destination becomes unavailable while requests continue. The queue cannot retain observations forever; dropping, blocking or spilling moves the consequence to a different place and must be measured separately.
Interpretation and evidence
- Make the buffer finite.
- Expose lost evidence.
- Observe recovery after export returns.
The observation pipeline deserves failure tests because it can become part of the application's availability story. Make its destination temporarily unavailable in an isolated environment. Observe whether the application blocks, accumulates memory, drops observations or recovers without intervention.
None of those outcomes should be described with a vague “handles failure” label. State the policy. For a low-risk diagnostic span, dropping data may be the sensible choice. For a durable business record, silent dropping may be unacceptable. Do not solve that distinction by calling a log an audit trail. The required durability and accountability belong in the design contract.
Bound the disruption and restore the destination before the run ends. Measure how much information is lost and how long recovery takes. Check whether delayed export changes the apparent order of events. If the dashboard orders by arrival time while the investigator assumes event time, the monitoring tool can tell a persuasive but incorrect story.
Test shutdown too. A configuration that appears efficient during steady state may leave a large amount of pending work when the process terminates. Report normal shutdown, abrupt termination and deliberate cancellation as different scenarios. Otherwise a convenient graceful drain can conceal the conditions under which production incidents actually lose evidence.
Publish the observation that would change the decision
A useful laboratory report ends with a bounded decision. For the declared workload and diagnostic questions, a particular configuration may meet the resource budget and preserve sufficient incident evidence. That conclusion should name what would invalidate it: a new attribute, a different exporter, a higher request rate, a rarer fault or a changed host limit.
Before executing the lab, write the falsification conditions. The suspicion that telemetry caused a regression weakens if the same regression appears in the disabled baseline. The proposed sampler fails if it repeatedly misses the evidence required to diagnose the injected incident. The configuration fails its resource contract if its queue grows without a bound during a destination outage, even when average request latency still looks comfortable.
The final evidence pack should make those outcomes inspectable. Include raw observations, configuration manifests, the injection schedule, rejected-run explanations and a short account of what remains unknown. Leave result cells empty until the experiment has actually run. An honest unresolved comparison is more useful than an attractive percentage with no defensible boundary.
Observability earns its place when it improves the next decision enough to justify the work it introduces. Treating the observer as part of the experiment makes that judgement possible. It also turns a familiar argument about “too much logging” into a concrete engineering discussion about what a team needs to know, what it is willing to spend to know it, and how it will notice when that trade has changed.
Executed companion: a local HTTP and OTLP boundary
The first executable companion narrows the larger procedure above to a boundary that can be inspected in one process. It was built and run on 12 November 2026 using SDK 9.0.203, runtime 9.0.4 and OpenTelemetry 1.11.2. Those versions precede the article's historical context. The execution itself does not: this is a contemporary laboratory addition, not a backdated measurement.
The program hosts a small ASP.NET Core application on an automatically assigned loopback port. A client calls /sum/32, and the application returns the sum of the squares of the integers from zero through 31. An independent formula gives the expected result, 10,416. Every measured response is checked against that expected value. The request does not access a database or an external service.
In the off configuration, the business code still calls ActivitySource.StartActivity, but no matching tracing provider is configured by this companion. In the batch configuration, a provider listens to the source, samples every operation, and exports OTLP over HTTP with protobuf encoding. Its destination is a second route on the same loopback application, /v1/traces. That route consumes the request body, counts requests and bytes, and returns an empty successful protobuf response.
The receiving route is deliberately a transport acknowledgement fixture. It is not a complete OpenTelemetry Collector, a trace database, a query interface or a validator for every individual span. Counting a received request proves that an encoded payload crossed the local HTTP boundary. It does not prove that a production backend would retain every span, index its attributes correctly or make it available for an investigator.
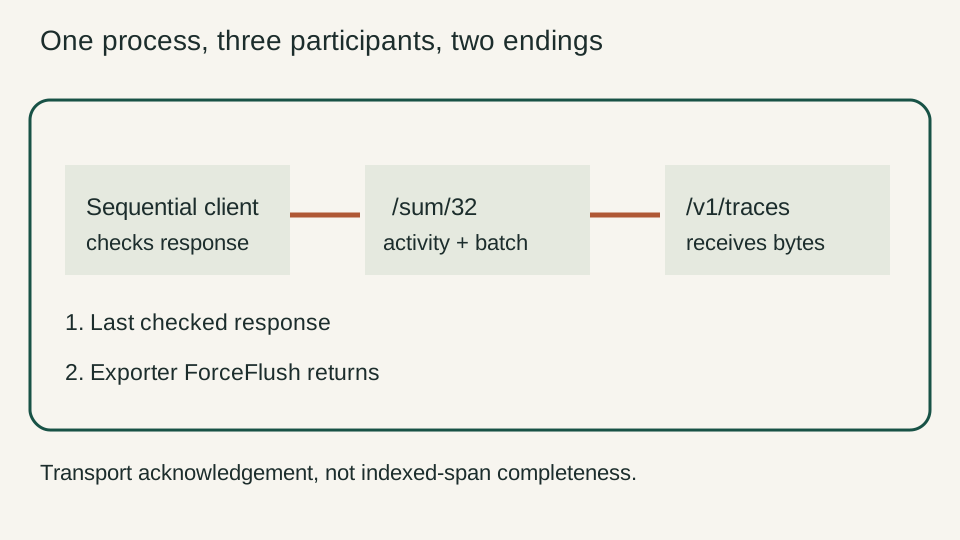
This design lets us include the serialization, exporter and HTTP receiving work without borrowing a real customer's collector or sending anything to a hosted observability service. It also creates an important limitation: all three participants share one process. The process-wide allocation counter includes the client, application and receiving route. There is no defensible way to label that total as server-only allocation.
The route's manually instrumented operation is small:
app.MapGet("/sum/{count:int}", (int count) =>
{
    if (count < 0 || count > 4096) return Results.BadRequest();
    using var activity = source.StartActivity("sum", ActivityKind.Internal);
    activity?.SetTag("input.count", count);
    long total = 0;
    for (int i = 0; i < count; i++) total += (long)i * i;
    activity?.SetTag("result.total", total);
    return Results.Json(new SumResult(count, total));
});
The work done by the endpoint is identical in both modes. The null-conditional tag calls do no tagging when no activity is returned. This is manual instrumentation of a named operation; it is not a test of every ASP.NET Core instrumentation feature or a universal estimate of the cost of tracing a web request.
A dedicated correctness mode checks the returned results for zero, one, 32 and 4096 elements. It also verifies that a negative count is rejected. With the provider enabled, it flushes the exporter and requires a positive received-request and received-byte count. These checks passed before the timing results were accepted. They establish the bounded response and transport contracts, not the diagnostic quality of a complete monitoring deployment.
The run includes two different endings
Each measured process first sends 100 warm-up requests. When tracing is enabled, it flushes the provider before recording the initial exporter counters. It then issues 1000 requests sequentially. The next request starts only after the preceding response has been parsed and checked. This is a closed-loop client and should be read as one. It cannot establish capacity under independently arriving demand, and it cannot demonstrate the absence of queue growth under overload.
The first ending is the completion of the last checked response. At that point the program stops the application-path stopwatch and records a process-wide allocation total. The second ending comes after ForceFlush returns. That interval is recorded separately as telemetry drain time, and allocations are observed again. Combining the two moments into a single latency number would hide the distinction the experiment is intended to teach.
The provider uses an explicit batch queue and batch size, and the local receiver is expected to acknowledge promptly. A successful flush in this environment should not be reinterpreted as a guarantee about a slow, disconnected or overloaded remote backend. Export failure, backpressure policies and retention under long outages remain separate experiments.
The program starts no public listener. Its loopback port is chosen for the process and closed when the process stops. Both provider and application are disposed in a finally path. The execution runner has an outer timeout and captures the process result. Reproduction therefore does not require leaving a development web server running after the measurements have been collected.
Six processes, including the inconvenient result
The run consisted of three fresh processes per configuration, with order alternated between repetitions. Each process checked all 1000 responses. The values below are the actual aggregate observations from that run, without discarding the configuration that appears surprisingly fast.
| Repetition and mode | Time for 1000 checked requests | Additional flush interval | Process allocation through flush | OTLP requests received |
|---|---|---|---|---|
| 1, off | 176.4427 ms | 0.0001 ms | 3,595,904 B | 0 |
| 1, batch | 169.0129 ms | 0.4206 ms | 4,476,712 B | 8 |
| 2, batch | 177.2558 ms | 0.4422 ms | 4,493,040 B | 8 |
| 2, off | 177.3967 ms | 0.0001 ms | 3,595,624 B | 0 |
| 3, off | 178.3520 ms | 0.0001 ms | 3,595,984 B | 0 |
| 3, batch | 174.6395 ms | 0.4050 ms | 4,493,528 B | 8 |
Each batch-mode process received 111,696 bytes of OTLP request payload after the warm-up counters were reset. The count is encoded-body bytes seen by this receiver. It excludes HTTP and transport framing and says nothing about the storage size of an indexed backend.
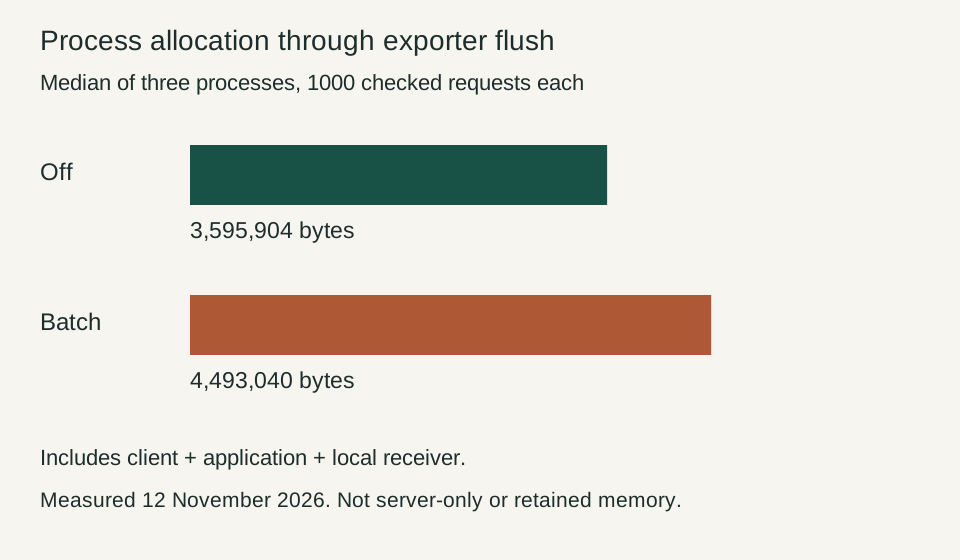
The allocation observation is straightforward within its boundary. Batch mode allocated roughly 0.9 MB more per process's measured interval than off mode, including the client, producer and receiver. The exact difference varies between the three processes. It is evidence that enabling this tracing path introduces additional managed allocation into this small system. It is not an allocation-site profile and does not assign those bytes to individual components.
The time observation is deliberately less satisfying. The batch-mode aggregate times overlap the off-mode times and are lower in two repetitions. That does not mean tracing makes the arithmetic endpoint intrinsically faster. These are short processes, with ordinary scheduling, JIT behavior and shared-host effects. A causal claim about a small response-time overhead is not established by this run.
It would be easy to publish only the allocation chart and imply that every cost moved in the expected direction. It would be equally easy to publish the fastest tracing run and advertise a speedup. Both would turn a narrow observation into an unsupported story. The useful conclusion is that the local tracing path performed additional allocation and export work while this short closed-loop timing experiment did not isolate a reliable application-latency penalty.
The raw file also contains the duration of every checked request. Keeping those samples makes the aggregate inspectable. It does not automatically make a percentile suitable for a production objective: there are only 1000 observations per process, generated by one sequential client after a specific warm-up. Different arrival behavior, concurrent requests and a remote collector can change the situation substantially.
Historical dependencies need a contemporary warning
Restoring the historical OTLP exporter produced NuGet warning NU1902. The relevant advisory concerns the experimental disk-retry feature falling back to a shared temporary directory. That is a real compatibility and security observation about the selected package, not something to conceal because the package is useful for historical reproduction. The advisory and affected versions are documented in GHSA-4625-4j76-fww9.
The companion does not enable disk retry, and it refuses to run when an experimental retry setting is inherited from the environment. Its exporter endpoint is explicitly local and its payload is synthetic. This bounded laboratory decision is not a recommendation to install the old package in a current production application. A production upgrade should choose an appropriate supported patch and revalidate behavior. Historical availability and present-day deployment suitability are different questions.
The refusal is part of making the experiment reproducible. Ambient configuration can silently change transport behavior, just as an unpinned runtime can change generated code. Rather than guessing what an inherited setting means, the companion requires an explicit laboratory environment. It does not print credentials, collect production traces or inspect an observability account.
What this companion leaves open
The proposed injected-fault investigation earlier in the article remains a separate scope. This companion does not measure whether a person can diagnose a hidden dependency fault faster with tracing enabled. It also does not decode the incoming protobuf to prove completeness of individual span identities. A subsequent quality experiment needs its own independent record of faults and a meaningful scoring rule.
A remote collector would introduce another process, queue and failure boundary. Its memory and CPU cannot be inferred from our process-wide totals. A more complete experiment should measure those resources explicitly, preserve the observation end times, and state whether exporter drain is included in each metric. Combining the two processes into an unlabelled total would hide where the work moved.
The outage experiment should also be distinct. If the receiver stops acknowledging, the producer's behavior depends on queue limits, exporter timeouts and the chosen loss or retry policy. That is a question about bounded resource use and evidence loss. It must not be tested by accidentally overwhelming a shared production collector.
Download the executable telemetry companion and raw results. From its lab directory, dotnet run -c Release -- check executes the response and transport checks. Running the built program with off or batch produces one bounded measurement record. Use fresh processes for repetitions and retain their output, including warnings and failed runs.
This is a more useful starting point than a slogan that observability is cheap or expensive. We can point to the business operation, the activity source, the exporter boundary, the receiver and two distinct endings. We can also point to an observation that failed to support the timing story we might have expected. That makes the next investigation specific: improve the experiment where uncertainty remains, rather than decorating an assumed conclusion with a dashboard.
Historical versions and verification boundaries
These pins existed before the context date. Availability and static API checks do not establish a successful build or a production-safe patch level. Execution claims are limited to explicitly identified companion checks.
| Component | Version | Available by | Source |
|---|---|---|---|
| OpenTelemetry | 1.11.2 | 2025-03-04 | Primary record |
| OpenTelemetry.Extensions.Hosting | 1.11.2 | 2025-03-04 | Primary record |
| OpenTelemetry.Exporter.OpenTelemetryProtocol | 1.11.2 | 2025-03-04 | Primary record |
| OpenTelemetry.Instrumentation.AspNetCore | 1.11.1 | 2025-03-05 | Primary record |
| BenchmarkDotNet | 0.14.0 | 2024-08-06 | Primary record |
| .NET SDK | 9.0.101 | 2024-12-03 | Primary record |
| .NET runtime / ASP.NET Core shared framework | 9.0.0 | 2024-12-03 | Primary record |