An Observable .NET10 Service Before the First Incident
The first incident is a poor time to discover that the most important part of an operation is invisible. The HTTP request looks healthy. The queue accepted a message. The worker emitted a few logs. The customer still did not receive the result.
Explore the mechanism ↓
Reading tools Listen or translate
Read aloud
Uses an installed voice on your device.
Translate article
Machine translation. Code and evidence notes stay in English.
Original English text.
START WITH THE MECHANISM
Interactive companion and laboratory update: 12 November 2026. The editorial date places the topic on the timeline; this current explanation and its measured evidence retain their actual preparation and execution dates.
THE FULL INVESTIGATION
An Observable .NET10 Service Before the First Incident
Dates and technology context
This is a retrospective editorial timeline. Topic context: 10 December 2025. First publicly available: 12 November 2026. Current text, visuals and laboratory revisions were prepared on 12 November 2026.
The executed service uses .NET/ASP.NET Core10.0.15, SDK10.0.400 and OpenTelemetry1.15.3. Its live Aspire capture and process observations are November 2026 updates, while .NET10/Aspire13 GA fit December2025.
The first incident is a poor time to discover that the most important part of an operation is invisible. The HTTP request looks healthy. The queue accepted a message. The worker emitted a few logs. The customer still did not receive the result.
Each component can be individually observable while the business operation remains unexplained. The missing piece is usually not another dashboard. It is a model of how work moves through the system and how evidence should follow it.
Consider a document-processing service: an API accepts a document, a worker extracts information and a database stores the result. The user experiences one operation. The implementation contains several lifetimes, retries and failure boundaries. An observable design preserves the relationship between them without pretending they are one long synchronous method.
The reference baseline is ASP.NET Core 10 with an Aspire 13 development environment. These versions were released together in November 2025. Their availability is established by the release notes; the examples below do not claim that a complete reference service has been run. Microsoft .NET 10 announcement, Aspire 13 release notes.
Define completion before defining a span
Start with the customer-visible state machine. “Accepted” means the system has durably taken responsibility for work. “Completed” means the requested result is available. “Failed” means the system has a terminal explanation. “Unknown” means the system cannot yet establish the outcome.
These states should not be inferred from the last log line that happens to exist. They belong in application state. Telemetry helps explain transitions, but losing a trace must not make an accepted document disappear from the product's accounting.
Give the business operation a stable identifier. A retry of a worker attempt should preserve that operation identity while producing a new attempt identity. This allows an operator to ask both “What happened to this document?” and “Which attempt experienced the timeout?”
A trace identifier serves a related but different purpose. It connects execution observations. It should not become the only durable key for the business process, because traces can be sampled, retained for a shorter period or split across long-running workflows. Keep operation identity and trace identity related without making them interchangeable.
Instrument decisions that change the next action
Automatic instrumentation can show HTTP requests and database calls. It cannot automatically know that a document was rejected because the format was unsupported or that a result was stored but not yet published to the user.
Add application spans around meaningful stages, with stable names such as document.validate and document.process. Avoid names containing an identifier, filename or arbitrary prompt. Those belong, when appropriate, in carefully controlled attributes or separate records.
The following .NET BCL fragment is illustrative and unexecuted. ActivitySource belongs to the application's instrumentation surface; a configured listener or OpenTelemetry provider must subscribe to the source for activities to be recorded.
using System.Diagnostics;

internal static class DocumentTelemetry
{
    public static readonly ActivitySource Source =
        new("Example.Documents", "1.0.0");
}

using var activity = DocumentTelemetry.Source.StartActivity(
    "document.validate", ActivityKind.Internal);

activity?.SetTag("document.kind", "invoice");
activity?.SetTag("validation.policy", "v1");
The null-conditional calls are intentional. Instrumentation must continue to work when a listener is absent or a sampling decision does not create an activity. Avoid computing expensive diagnostic payloads merely to discard them. Microsoft's walkthrough explains the instrumentation and collection separation. Adding distributed tracing in .NET.
Wire collection explicitly
01 / See the idea
Emission is only the first handoff
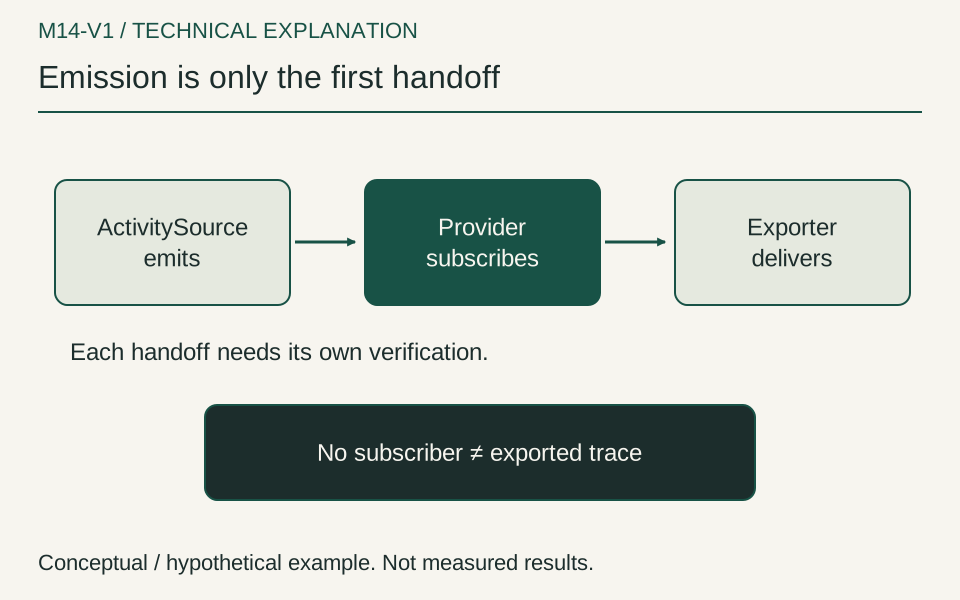
A hypothetical validation stage emits an activity named document.validate. If no provider subscribes to its source, a dashboard has no exported record even though the application ran.
Interpretation and evidence
- Emitting is not exporting.
- Subscribe to the correct source.
- Check the destination separately.
An emitted activity is not automatically an exported trace. Configure the source, the exporter and the destination deliberately. A minimal host can subscribe to the application source through OpenTelemetry's hosting extensions; the following configuration fragment assumes OpenTelemetry.Extensions.Hosting 1.9.0 and an appropriately configured exporter in the complete application.
// Illustrative registration fragment, not a complete host.
using OpenTelemetry.Trace;

builder.Services.AddOpenTelemetry()
    .WithTracing(tracing => tracing
        .AddSource("Example.Documents"));
This intentionally stops before choosing transport credentials or a production backend. Pin the complete set of instrumentation and exporter packages together in the runnable project. The hosting package's role is to start and stop telemetry providers with the application host; it does not guarantee that a destination is reachable. OpenTelemetry hosting package 1.9.0.
In an Aspire development environment, inspect the service's traces and logs together. Use the dashboard to test the shape of the evidence, not as proof of production retention, access control or incident readiness. A local dashboard seeing a span is the beginning of verification, not its conclusion.
Cross the queue boundary deliberately
A message queue ends one execution lifetime and starts another. The producer can finish before the consumer starts, and a consumer can run several times for the same message. Treating the consumer as ordinary continuation code hides those realities.
Propagate trace context through supported message metadata, using the messaging SDK's instrumentation where it is available and verified. If the application uses a custom envelope, make propagation an explicit adapter responsibility. W3C Trace Context standardizes the representation used across services, but the application still has to preserve it at the asynchronous boundary. W3C Trace Context Recommendation.
// Custom envelope contract; illustrative and unexecuted.
public sealed record WorkEnvelope(
    Guid OperationId,
    string PayloadReference,
    string? TraceParent,
    string? TraceState);

var current = Activity.Current;
var message = new WorkEnvelope(
    operationId,
    payloadReference,
    current?.Id,
    current?.TraceStateString);
On consumption, parse the remote context rather than treating it as an arbitrary parent string. Decide whether the consumer should be a child of the producer or linked to it, especially for batch processing and long delays. Do not create duplicate spans if the broker SDK already instruments the same boundary.
Trace context is correlation data, not authorization. A message carrying a trace identifier does not gain permission to access the referenced payload. Tenant scope, payload ownership and worker permissions require their own checks.
Distinguish waiting from working
02 / A concrete example
The user waits before the worker starts
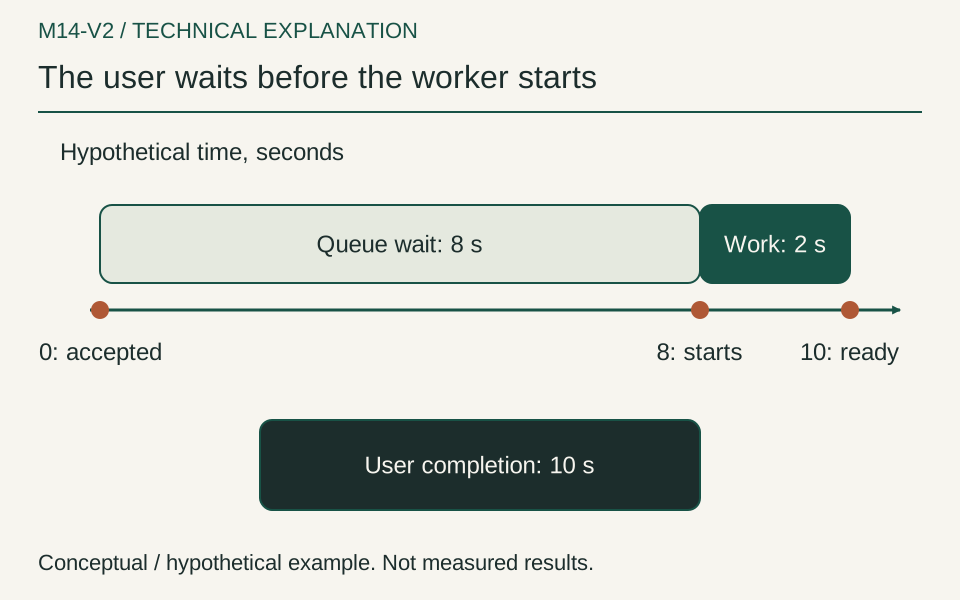
In this arithmetic example, acceptance occurs at second 0, processing starts at second 8 and the result is ready at second 10. Worker duration is 2 seconds; user completion time is 10 seconds.
Interpretation and evidence
- Report the queue interval.
- Keep worker duration separately.
- These times are hypothetical.
An operation that takes ten minutes may have spent almost all of that time waiting for a worker. If the only measured span surrounds execution, the service can look fast while users experience a long delay.
Record queue age and processing duration separately. Capture the time of durable acceptance and the start of each processing attempt. Use appropriate clock assumptions: durations measured within a process can use a monotonic timer, while timestamps exchanged between machines depend on synchronized clocks and deserve cautious interpretation.
A business completion metric should include the period relevant to the user. A worker utilization metric should not. Both are useful, but they answer different questions. A dashboard that labels worker execution time “document latency” creates a semantic error that no query optimization will fix.
Also distinguish a retry delay from useful work. A document may spend time waiting because the system deliberately backs off after a dependency failure. That is an operational policy, and it should be visible as such. Otherwise the same delay can be misdiagnosed as queue capacity, model speed or database performance.
Model attempts and settlement honestly
Azure Service Bus distinguishes receiving a message from settling it. A message can require redelivery if processing or settlement does not complete as expected. That behavior makes idempotent processing important and changes how we interpret a trace. Service Bus message settlement.
Give each attempt its own outcome. An attempt may fail while the business operation later succeeds. If every failed attempt increments a metric named documents_failed, the reported business failure rate will be wrong. Use separate measurements for attempts and terminal operations.
Do not mark the business operation complete merely because a worker returned from its processing method. The result may still need to be committed, acknowledged or published. Conversely, a settlement failure after a successful database commit can lead to redelivery without implying that the earlier work was lost.
The evidence should make this uncertainty inspectable. Record the committed result identity, the attempted settlement and any reconciliation outcome. A trace that ends in an exception is not necessarily a failed business transaction. The durable state remains the authority for that conclusion.
Preserve useful context without collecting the document
03 / Watch the mechanism
Commit and settlement can disagree
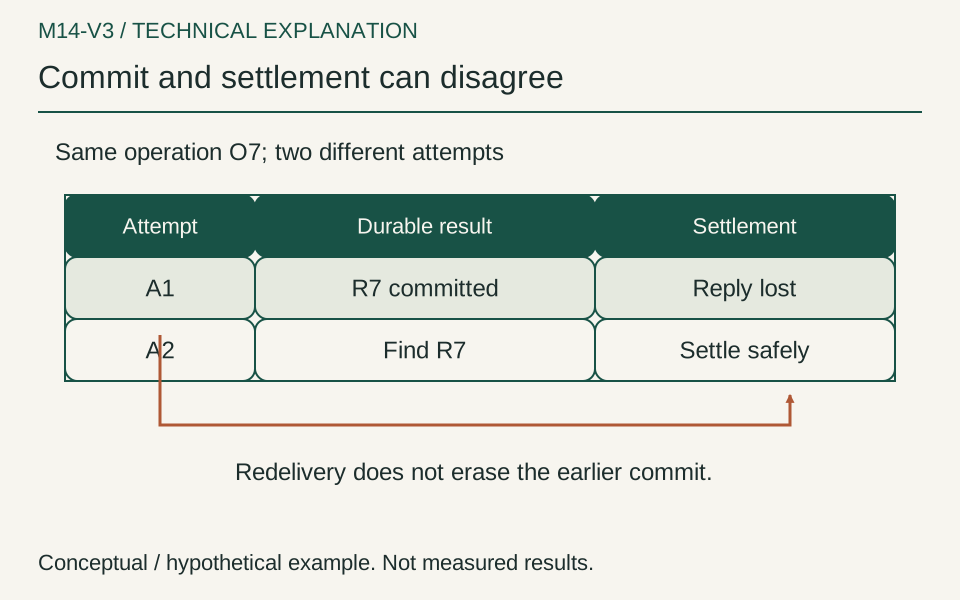
Static view. Play to see how the mechanism unfolds.
A hypothetical worker commits result R7 and loses its message acknowledgement. A redelivery creates another attempt, while the durable operation can still have only one accepted result.
Interpretation and evidence
- One operation can have several attempts.
- Lost settlement is not lost commit.
- Read durable state before repeating effects.
During an incident, full request and response bodies are tempting. They can also turn an observability system into an uncontrolled duplicate of sensitive business data.
Prefer structural information: document category, processing stage, bounded failure code, policy version and result identifier. If a specific diagnostic case requires content, make that an explicit, restricted workflow with a retention policy. Do not enable indiscriminate content capture because it makes a dashboard more convenient.
The same principle applies to AI operations. A prompt may contain a customer's document or a confidential instruction. Token counts, model deployment identity and a failure category can be useful without storing the prompt. When detailed content is necessary for evaluation, separate the evaluation dataset from general operational telemetry.
Treat identifiers with care even when they are not obvious personal information. A filename or resource path can reveal a customer name or internal structure. The question is not simply whether a field is called “PII.” It is whether collecting that field is necessary for a defined diagnostic decision.
Rehearse a failure before depending on the evidence
Create a small reference scenario with a known expected result. Submit it through the API, follow the message into a worker and confirm the final durable state. Verify that the operation identifier remains consistent and that the trace relationship crosses the queue boundary.
Then introduce one controlled failure at a time in an isolated environment. Delay the consumer. Fail the dependency before processing. Fail after the result is written but before message settlement. Cancel the caller after acceptance. Restart the worker during an attempt. The question is not just whether the system recovers, but whether an operator can explain the recovery from the evidence.
Test absent telemetry as well. Disable the exporter or make its destination unreachable. The application should follow its declared buffering and failure policy. Observe whether export pressure changes request latency, memory or shutdown behavior. Telemetry is part of the system and can fail independently.
The full production-oriented failure set has not been executed. The contemporary companion below verifies the narrower HTTP/Channel/dependency correlation path. A publishable empirical companion should retain configuration, raw traces, durable-state queries and actual execution dates. Until then, this is an instrumentation design and test protocol, not a claim of demonstrated reliability.
Build an explanation path, not a wall of signals
Before the first incident, ask an engineer unfamiliar with the service to answer a few questions: Was the request accepted? Where did it wait? Which attempt last made progress? Was a result committed? Is retry safe? What evidence is missing?
If those questions require guessing from unrelated log messages, the service is not yet observable in the way its operators need. More volume may make the guessing slower. A smaller set of connected observations can be much more valuable.
The goal is not to capture everything. It is to preserve an explanation of responsibility as work moves across boundaries. That explanation should survive retries, missing traces and the ordinary uncertainty of distributed execution. When an incident arrives, the team can then investigate a system whose evidence was designed to answer questions, rather than a system that merely emits data.
Run the boundary before describing the architecture
The companion laboratory now executes the core correlation path. It starts a real ASP.NET Core HTTP server, submits work through an HTTP endpoint, transfers an envelope through a bounded Channel, processes it in a worker and calls a dependency through HTTP. The dependency returns an actual response body, and the worker reads the returned value before declaring completion.
The server and worker live in one process, and the dependency endpoint belongs to that same local server. This arrangement exercises HTTP serialization, header propagation, queue transfer and asynchronous lifetimes. It does not demonstrate cross-machine networking, broker delivery guarantees or deployment orchestration. Those are additional boundaries, not automatic consequences of seeing a successful local trace.
The channel capacity is eight. The experiment submits three small synthetic operations sequentially: one succeeds immediately, one receives a planned transient dependency failure and then succeeds, and one is cancelled through an explicit operation-cancellation endpoint. A process-wide timeout bounds the demonstration, and shutdown completes the channel, cancels outstanding work and waits for the worker.
The executable's state is held in concurrent in-memory collections. Its HTTP 202 response therefore says only that this process accepted the work. It does not satisfy the durable acceptance contract described earlier in the article. The response and evidence explicitly label the scope as process memory. A crash can lose accepted work and its result. The laboratory is a correlation and lifecycle example, not a durable workflow engine.
That distinction is central to the lesson. A beautiful trace cannot turn volatile memory into a reliable queue. If the product promises durable acceptance, the production implementation needs a durable responsibility boundary and tests for restart and recovery. The demonstration leaves that work visible rather than allowing the word accepted to conceal it.
Execution took place on 12 November 2026 with SDK 10.0.400 and .NET/ASP.NET Core 10.0.15. The historical design context remains December 2025. The current runnable companion uses OpenTelemetry 1.15.3; it does not claim that this package was available at the earlier context date. The original 1.9.0 snippets remain historical explanatory fragments, not a recommendation to deploy that old dependency.
The version distinction became concrete during preparation. Restoring the older package surfaced two published security advisories, so the contemporary companion was moved to the patched 1.15.3 release before the final run. This changes the execution dependency, not the historical availability claim. OpenTelemetry propagation advisory, OTLP exporter advisory.
Follow three identifiers through one retry
01 / A concrete example
One operation, distinct attempts
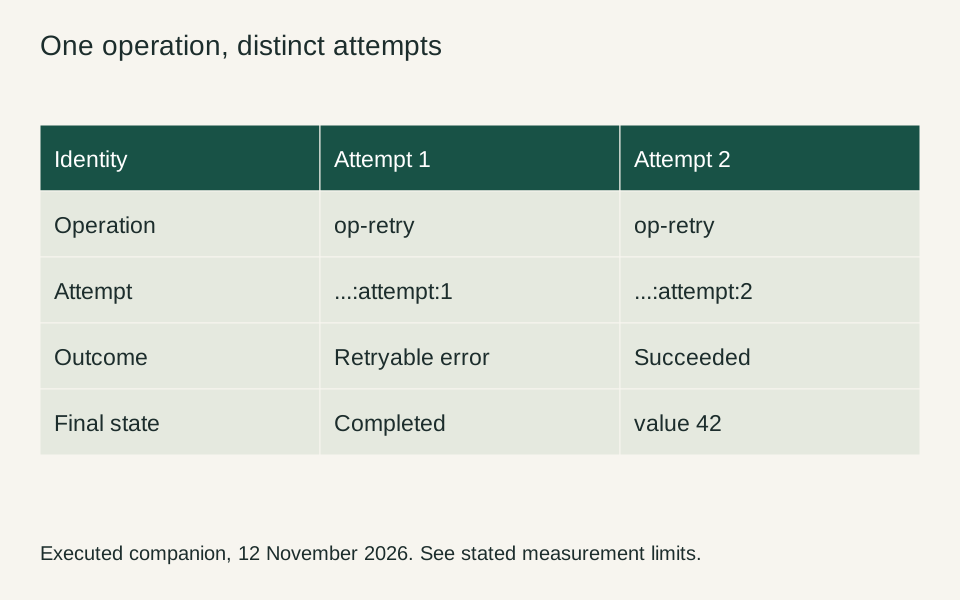
The failed first attempt does not imply a failed business operation. The final state is checked separately from the span status.
Interpretation and evidence
- Preserve operation identity.
- Give every attempt a distinct identity.
- Check terminal state independently.
The operation identifier is stable: the retry scenario is op-retry throughout its lifecycle. Its attempt identifiers are op-retry:attempt:1 and op-retry:attempt:2. The trace identifier is a separate W3C value generated for the client submission. The evidence retains all three identities because they answer different questions.
The client sends its traceparent header explicitly. The acceptance endpoint parses that remote context and creates an operation.accept activity. The envelope carries the activity's traceparent and tracestate representation into the Channel. On consumption, the worker parses that context and creates an operation.process activity with the accepted work as its parent.
This is the executed worker boundary:
ActivityContext.TryParse(envelope.TraceParent,envelope.TraceState,true,out var parent);
using var processing=source.StartActivity("operation.process",ActivityKind.Consumer,parent);
processing?.SetTag("operation.id",envelope.Id);processing?.SetTag("queue.age.ms",Stopwatch.GetElapsedTime(envelope.Enqueued).TotalMilliseconds);
Each attempt receives a new child activity. The worker then places that attempt's context on the dependency HTTP request, and the dependency endpoint parses it as a remote parent. The correctness checks verify the resulting relationships using recorded span IDs. Sharing a trace ID alone would be weaker: unrelated siblings could share a trace while the intended queue or dependency edge was missing.
For every scenario, the checks require the consumer's parent span ID to match the acceptance span ID. For every dependency call, the parent must be one of that operation's attempt spans. All application spans carrying the operation ID must share the expected trace ID. The retry scenario must have two distinct attempts while keeping the same operation identifier.
These checks are small, but their expectations are independent of a dashboard's presentation. A backend can display several attractive rows even when parenting is wrong. Conversely, a sampling policy can hide part of a correctly instrumented execution. Here the provider uses an always-on sampler so that the controlled test can validate the complete set it expects.
The first dependency attempt returns HTTP 503 by design. The worker records a retryable failure, waits briefly and tries once more. The second dependency response supplies value 42, which becomes the terminal result. The operation succeeds despite a failed attempt. Reporting the first attempt's error as a permanently failed operation would therefore be a semantic mistake.
The cancellation scenario demonstrates a different terminal result. A separate operation-cancellation request cancels the operation's own token while the worker is waiting. It produces one cancelled attempt and no result value. This is not a test of cancelling the submitting HTTP request, killing the worker or recovering after a crash. Those cases remain outside the executed scope.
Read the actual dashboard with its boundaries intact
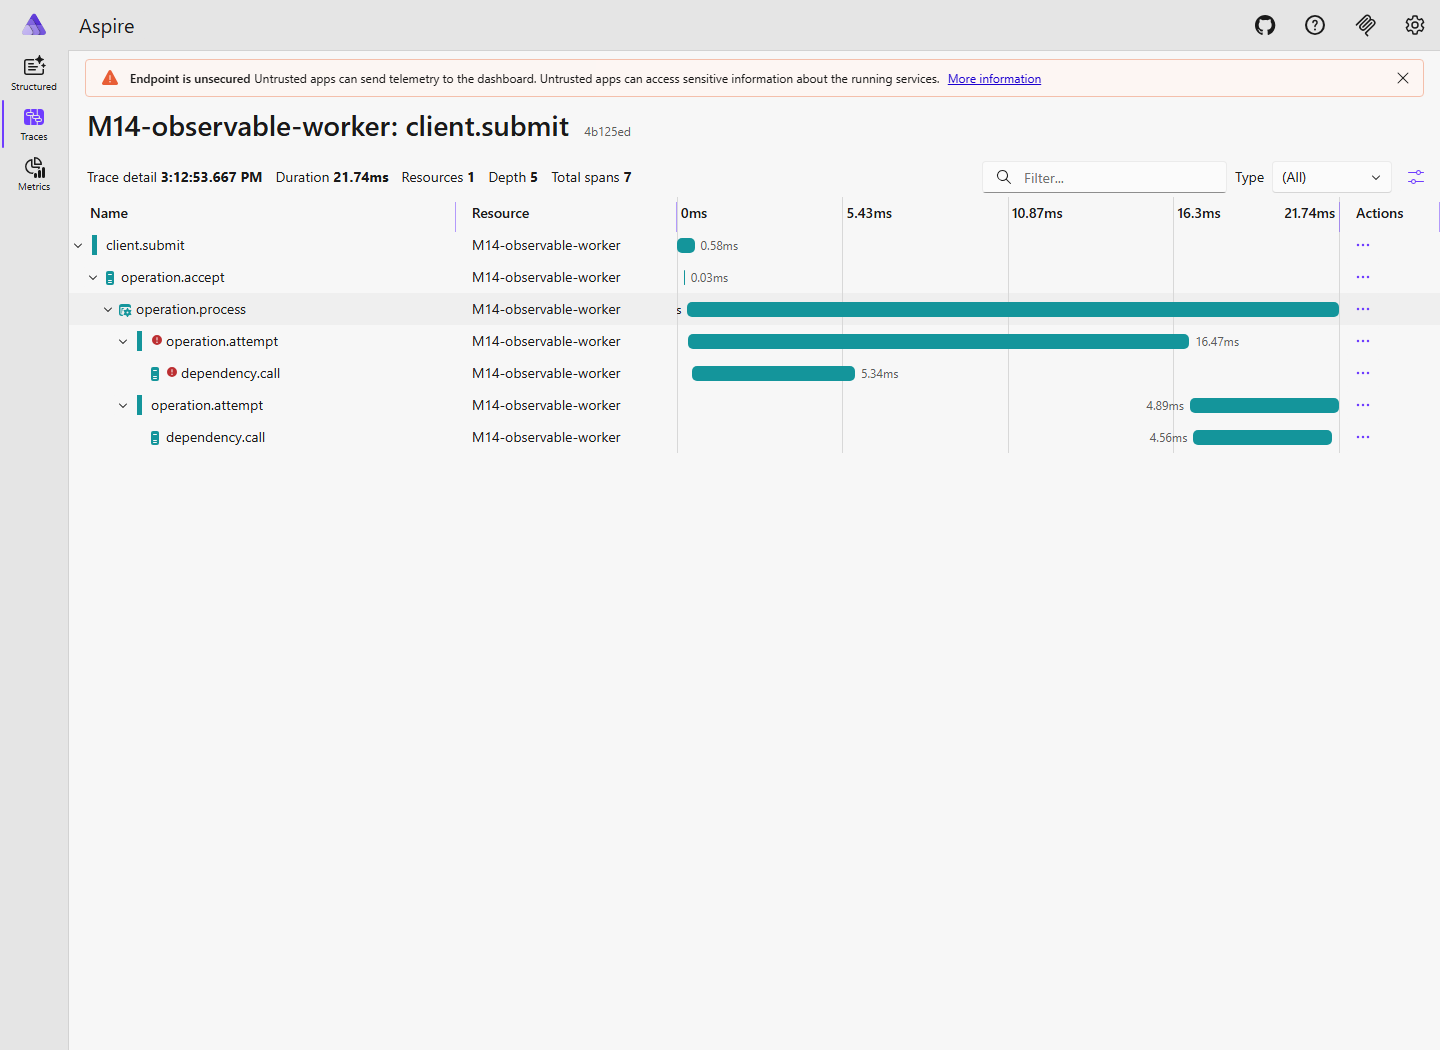
The exported spans were received by the standalone Aspire 13.0.0 dashboard. The captured list contains three traces. The retry trace opens into a seven-span tree: client submission, acceptance, processing, two attempts and two dependency calls. The screenshot is a real view of those exported events, not a reconstructed illustration.
The dashboard ran in a disposable container with one CPU and a 512 MiB memory limit. Its frontend and OTLP ports were mapped only to ephemeral loopback ports. Anonymous access was configured for that isolated local demonstration, and the container was removed after the screenshot was captured. No public dashboard or persistent telemetry service was created.
This is a standalone dashboard test. There is no Aspire AppHost project orchestrating the service, and there is no claim that Aspire provisioned the Channel, HTTP endpoints or application state. The tagged dashboard documentation explicitly distinguishes telemetry reception from the resource-service integration that supplies orchestration views. Aspire 13 dashboard configuration.
The retry trace is particularly useful because it looks partly unsuccessful. Its first attempt and dependency call have error status. The second attempt succeeds, and the in-memory operation state is Completed with value 42. The red mark is evidence of an attempt outcome, not sufficient evidence of the customer's final outcome.
The screenshot also exposes a timing-boundary choice in this small implementation. The first attempt activity remains open during the retry backoff, while the attempt's separate elapsed-time record stops when the failed call is handled. The span therefore measures an attempt lifecycle that includes waiting before the next attempt, while that numeric record measures the call-handling segment. They should not be compared as if they were the same interval.
A production design can make another choice, such as a separate retry.backoff activity. The important requirement is to name and document the chosen boundary. Otherwise an operator may interpret a long attempt span as a slow dependency even when much of that interval was a deliberate delay after the dependency already failed.
The same caution applies to the short client.submit activity. Its lifetime ends after acceptance; the worker can continue after it closes. A parent ending before its asynchronous child is not automatically a broken trace. The trace represents causal relationships across a queue boundary, not a promise that every parent span encloses all descendants in wall-clock time.
Verify outcomes and timing without turning the demo into a benchmark claim
02 / A concrete example
Observed completion is a specific boundary
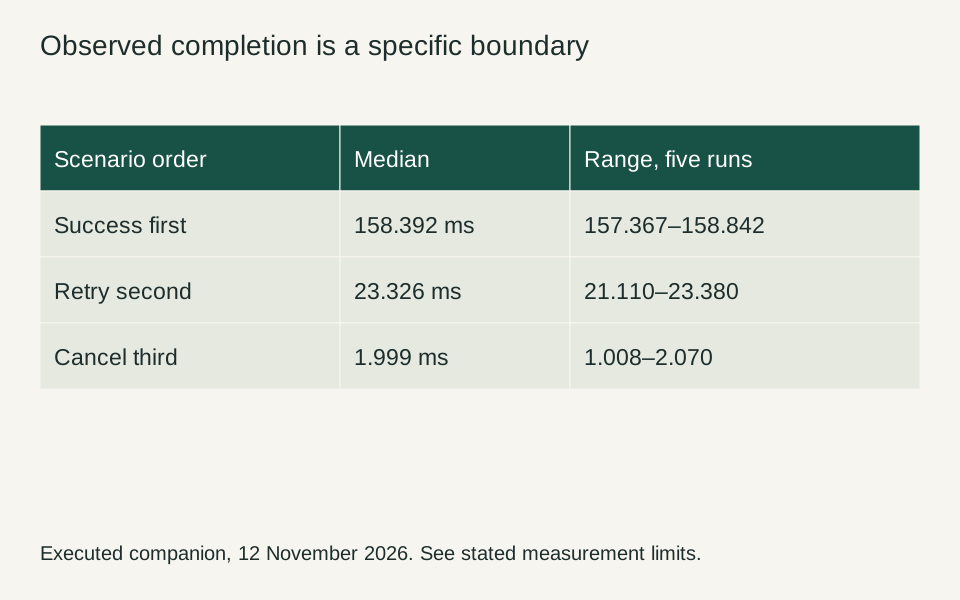
First-use and polling costs differ between the fixed-order scenarios. These durations are not a ranking of dependency paths or a production latency promise.
Interpretation and evidence
- Keep scenario order visible.
- Separate completion from attempt time.
- Do not infer overhead from unrelated boundaries.
The final code executes three terminal-state checks, trace-continuity checks for each operation, queue-parent checks, dependency-parent checks and the four-attempt identity assertion. The immediate-success operation uses one attempt, the recovered operation uses two and the cancelled operation uses one. The captured dashboard has five, seven and four spans for those respective cases.
| Scenario | Median observed completion | Range across five processes | Attempts | Terminal state |
|---|---|---|---|---|
| Immediate success | 158.3923 ms | 157.3669–158.8424 ms | 1 | Completed |
| Recovered retry | 23.3263 ms | 21.1104–23.3796 ms | 2 | Completed |
| Operation cancellation | 1.9986 ms | 1.0084–2.0704 ms | 1 | Cancelled |
The timing runs use the in-process snapshot exporter so that span relationships remain inspectable. They do not export to the dashboard. The separate dashboard run establishes OTLP reception and visual inspection; the timing run is not a measurement of Aspire or network exporter overhead. Keeping those experiments distinct prevents a useful screenshot from silently changing the meaning of the performance table.
Each process executes the success scenario first, then retry, then cancellation. The first scenario can therefore include initialization and first-use costs that later scenarios do not. The table should not be read as evidence that a successful dependency is intrinsically slower than a retry. The retry includes a planned delay; the cancellation includes an explicit request; the scenarios have different work and lifecycle positions.
The harness measures from submission through observation of the terminal HTTP result. Its polling loop adds observation granularity. That duration is different from a worker-attempt span, from the dependency's own processing time and from queue age. A useful service dashboard should preserve those distinctions rather than place all four numbers under a generic latency label.
The experiment does not prove operation durability, restart safety, broker settlement, production sampling behavior or correctness under arbitrary concurrent submissions. Its finite input and process-local queue make the evidence easier to audit. Extending it to a durable workflow should add persistence and recovery tests before changing the acceptance promise.
There is still a concrete gain over an unexecuted architecture sketch. The code shows how an operation ID survives a retry, how attempt IDs remain distinct, how W3C context crosses the actual HTTP and queue boundaries, and how those relationships appear in a real telemetry backend. An operator can now connect the visible failure to a specific attempt and check the final operation state without inventing the missing links.
Make the next failure explainable by construction
There is a temptation to treat this demonstration as a checklist: HTTP spans present, queue parent present, dashboard screenshot present, therefore observability complete. That conclusion would repeat the mistake the article began with. The fixture is useful because it makes a specific set of relationships executable. The scope of that evidence is smaller than the operational promise of a production system.
For example, the cancellation endpoint identifies an operation in process memory. Its behavior is verified while that process is alive. If the process restarts, the dictionaries and Channel disappear. A production cancellation command needs a durable identity and a rule for work that may already have committed an external effect. The trace can help investigate that decision, but it cannot supply the missing persistence contract.
The dependency is similarly controlled. It is another HTTP route in the same local application, with a deterministic failure rule. That is valuable for forcing the first attempt to fail and checking the second attempt's parentage. It is not evidence about authentication, remote DNS resolution, regional latency or a vendor's retry behavior. Extending the example to a real dependency should add those conditions deliberately and retain the controlled case as a regression fixture.
The chosen span names are application-owned and stable. The operation identifier is stored as an attribute rather than included in a unique span name. This supports a readable trace without turning every operation into a new category of activity. It does not prove that every attribute is appropriate for unrestricted retention. A real application must review the sensitivity and diagnostic purpose of each field before exporting it.
The absence of a result is also a meaningful observation. In the cancellation scenario, the worker reaches a terminal state without a value. The evidence should preserve that difference instead of forcing every path into a success-shaped object. An operator can then distinguish a correctly cancelled operation from a lost result or a successful dependency whose response was not observed.
A next iteration could introduce a durable work table and an independently owned worker process. That would be a new experiment with restart and acknowledgement cases. Another could test sampling and loss of exported spans while proving that operation accounting remains complete. A third could measure a slow exporter under a declared buffering policy. These are useful extensions precisely because the current laboratory does not pretend to have performed them.
Download the complete observable-service laboratory and execution records. The archive preserves the application, pinned dependencies, recorded spans and actual dashboard capture. The runner's measurement mode uses a snapshot exporter; dashboard mode sends the same instrumentation to the isolated Aspire receiver. Keep those modes distinct when interpreting the output.
The practical standard is whether another engineer can answer a question without reconstructing an undocumented convention. Which operation is this? Which attempt failed? What state did the application accept as final? Which relationships were verified, and which rely on an assumption outside the fixture? An observable design should make those questions easier even when the result is a refusal, a cancellation or an unresolved outcome.
That is the engineering value of the demonstration. It does not promise that an incident will be simple. It gives the incident a vocabulary, identifies the authoritative state and preserves a connected trail from request to attempt to result. The work of designing those boundaries should happen before a dashboard is asked to explain an unfamiliar failure.
Historical versions and verification boundaries
These pins existed before the context date. Availability and static API checks do not establish a successful build or a production-safe patch level. Execution claims are limited to explicitly identified companion checks.
| Component | Version | Available by | Source |
|---|---|---|---|
| .NET SDK | 10.0.100 | 2025-11-11 | Primary record |
| .NET runtime | 10.0.0 | 2025-11-11 | Primary record |
| ASP.NET Core shared framework | 10.0.0 | 2025-11-11 | Primary record |
| C# | 12.0 | 2024-12-03 | Primary record |
| Aspire.Hosting.AppHost | 13.0.0 | 2025-11-11 | Primary record |
| OpenTelemetry.Extensions.Hosting | 1.9.0 | 2024-06-14 | Primary record |
| OpenTelemetry | 1.9.0 | 2024-06-14 | Primary record |