When Monitoring Becomes the Workload
A monitoring system can correctly report that a database is struggling while helping to make it struggle. That is an uncomfortable property of observability: the observer participates in the system it describes.
Explore the mechanism ↓
Reading tools Listen or translate
Read aloud
Uses an installed voice on your device.
Translate article
Machine translation. Code and evidence notes stay in English.
Original English text.
START WITH THE MECHANISM
Interactive companion and laboratory update: 12 November 2026. The editorial date places the topic on the timeline; this current explanation and its measured evidence retain their actual preparation and execution dates.
THE FULL INVESTIGATION
When Monitoring Becomes the Workload
Dates and technology context
This is a retrospective editorial timeline. Topic context: 10 June 2026. First publicly available: 12 November 2026. Current text, visuals and laboratory revisions were prepared on 12 November 2026.
The real SQL workload and observer comparison ran in November2026 on SQL Server16.0.4315.2. The June2026 conceptual argument must not imply that this later build or run already existed.
A monitoring system can correctly report that a database is struggling while helping to make it struggle. That is an uncomfortable property of observability: the observer participates in the system it describes. It allocates memory, consumes CPU, opens connections, moves bytes and asks questions that the database must answer.
The useful engineering question is therefore larger than whether we have enough telemetry. We need to ask how much disturbance we can afford, what evidence that disturbance purchases, and how the observer behaves when the observed system is already close to failure.
My thesis is that monitoring deserves a workload budget and a failure model. Without them, a beautifully instrumented service can become least trustworthy at the exact moment when its measurements matter most. This is a design argument and an experiment proposal, not a report of measurements from a production incident.
Put the observer inside the boundary
Draw the request path from arrival to a useful result. Then add everything that exists because someone wanted to understand that path: instrumentation callbacks, structured logging, serialization, export buffers, network transfers, collector processors, storage ingestion and dashboard queries. Add database polling too. These components may run on separate machines, but separation does not remove their effect on shared resources.
Some costs occur synchronously on the request path. Others accumulate elsewhere until a queue fills or a shared resource becomes scarce. A buffered exporter can move network work out of the request, yet recording and enqueueing still happen somewhere. The relevant boundary includes those costs and their failure behavior.
It also includes decisions triggered by telemetry. An alert may start a diagnostic job. A dashboard refresh may issue expensive queries. A retry policy may produce more attempts when latency rises. The system being measured now contains both the measuring machinery and its reactions.
This is why a single number called observability overhead is often too vague. CPU overhead under steady traffic says little about behavior during an exporter outage. Average allocation says little about a burst of exceptionally large log records. A useful budget distinguishes normal operation, saturation and partial failure.
Count the unit that produces the cost
01 / See the idea
Small decisions multiply into workload
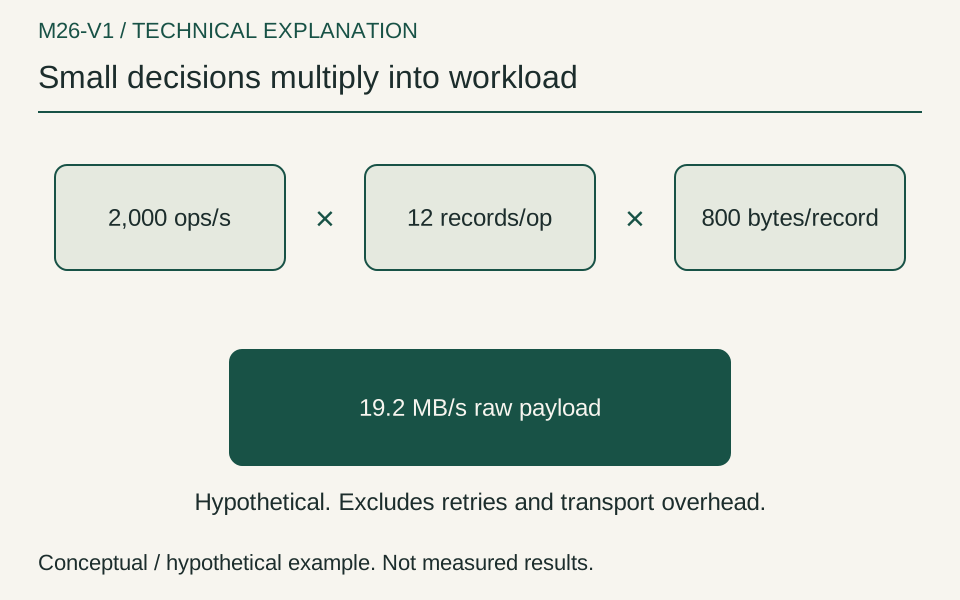
Assume 2,000 operations each second, 12 records per operation and 800 bytes per record. The raw rate is 19.2 MB per second before retries and additional transport work; it is an arithmetic model, not a measurement.
Interpretation and evidence
- Count the producing unit.
- Include attempt amplification.
- Raw bytes exclude other overhead.
Suppose, as a deliberately hypothetical calculation, a service handles 2,000 operations per second and creates 12 records per operation. That is 24,000 records per second before retries, batching metadata or collector transformations. At an assumed average encoded size of 800 bytes, the raw payload rate is 19.2 megabytes per second. These are arithmetic assumptions, not benchmark results.
The calculation is valuable because it exposes multiplication. Operations multiply into attempts, attempts into spans and log events, and those events into attributes and bytes. A small per-event decision can become a large system decision.
Metrics have a different multiplication problem. If an instrument uses three independent dimensions with 20, 50 and 100 possible values, the theoretical cross-product is 100,000 combinations. The actual series count depends on observed combinations and backend behavior, but the design already contains a warning. Adding a customer identifier can make the bound depend on business growth instead of a controlled vocabulary.
Use bounded categories for aggregate measurements and put necessary correlation identifiers in signals with a deliberate retention and access policy. The .NET metrics documentation describes instruments, measurements and tags; choosing a sustainable dimension set remains an application responsibility. Microsoft's metrics instrumentation guide
The right question for every field is specific: which decision becomes possible because this field exists? A field that has no consumer still has a producer cost, a storage cost and potentially a privacy cost.
Polling is executable work
A database monitoring query is a query. It can require CPU, memory, metadata access and result transfer. Joining several diagnostic views, sorting large intermediate results or repeatedly extracting plan text should not be treated as free merely because the query is administrative.
Start with a question narrow enough to answer cheaply. For example, distinguish requests currently waiting for an execution memory grant from a historical aggregate of completed statements. These are different observations, with different lifetimes and limitations.
The following SQL Server 2022 fragment is an illustrative, unexecuted snapshot. It deliberately avoids collecting SQL text and plans. It does not prove which request caused pressure, and it is not a recommendation to poll continuously at a particular frequency.
SELECT
    SYSUTCDATETIME() AS observed_at_utc,
    session_id,
    request_id,
    request_time,
    grant_time,
    requested_memory_kb,
    granted_memory_kb,
    used_memory_kb,
    wait_time_ms
FROM sys.dm_exec_query_memory_grants
WHERE session_id <> @@SPID;
Interpret the fields as a snapshot of execution memory grants, not as total server memory consumption. A missing row is not proof that a query never needed memory. The view's documented meaning and permission requirements are part of the monitoring design, especially when a restricted service account runs it. SQL Server memory-grant DMV documentation
Historical aggregates have another trap. Rows in sys.dm_exec_query_stats are associated with cached plans, and the statistics describe completed executions. Plan removal removes the corresponding rows. Subtracting two snapshots without checking identity, plan lifetime and counter continuity can manufacture a misleading interval result. SQL Server query-statistics DMV documentation
Treat every polling result as evidence with an observation time, scope and known blind spots. A monitoring table without these qualifications can look more authoritative than the underlying observation deserves.
The dangerous loop begins near saturation
Consider a service where the database becomes slower. Requests stay in flight longer. More requests overlap. Some callers time out and retry. Each attempt creates additional telemetry. Export queues grow, and operators increase diagnostic detail to understand the incident. Diagnostic queries now compete with business queries.
No single component needs to be badly implemented for this loop to hurt. Several locally reasonable behaviors can combine into a globally unreasonable workload.
The design task is to break the loop at explicit points. Bound retries and distinguish an operation from its attempts. Bound diagnostic concurrency. Make export queue behavior visible. Decide whether a full telemetry buffer drops, blocks or spills, and understand the consequences of that choice. Reserve enough independent evidence to notice that telemetry itself is failing.
There is no universally correct overflow policy. Dropping low-priority diagnostic events can protect the service while reducing visibility. Blocking can preserve records while extending user latency. Spilling can move pressure to disk and introduce recovery work. The choice depends on what the records mean. An accounting ledger and a debug trace cannot share an accidental failure policy.
The most revealing test is often an unavailable telemetry destination during a busy period. Does the application remain useful? Can an operator tell that evidence is missing? Does reconnecting cause a catch-up burst that damages the recovering system? Normal operation does not answer these questions.
Instrument the instrumentation, sparingly
02 / A concrete example
A full buffer requires a chosen policy
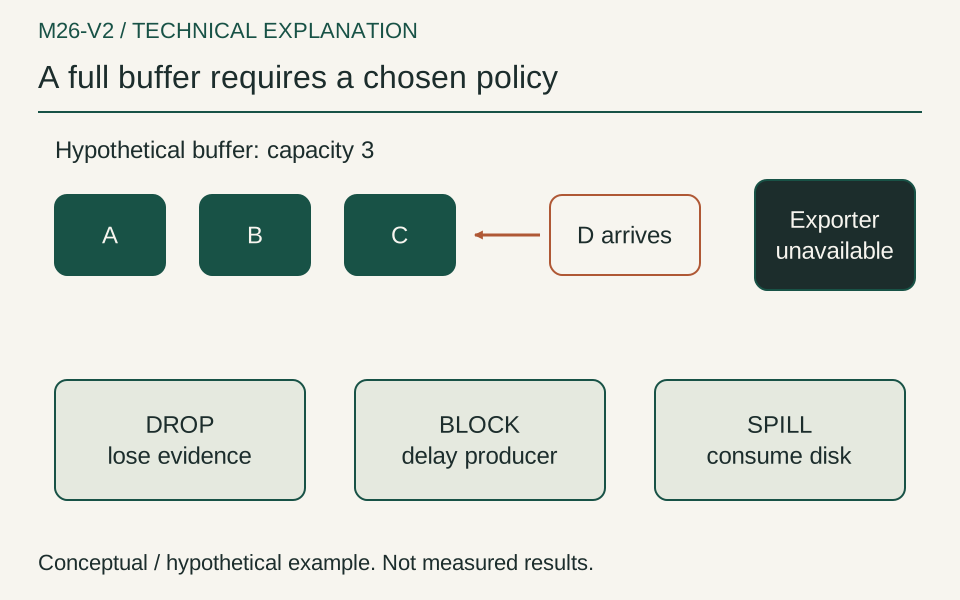
With three occupied slots, record D cannot be accepted for free. Dropping loses evidence, blocking delays the producer, and spilling moves work to storage; the contract must choose deliberately.
Interpretation and evidence
- Measure lost records.
- Measure queue age, not only export time.
- An audit ledger needs its own durability.
An exporter needs a small set of operational facts: queue depth, dropped records, export attempts, successful exports and the age of the oldest pending batch. Those facts should not depend exclusively on the failing export path. A local health surface or a separate minimal channel can provide an independent view.
Application code should also avoid doing expensive preparation only for a measurement that will not be consumed. But optimization must follow evidence. Removing every allocation around instrumentation before checking whether SQL polling dominates would be misplaced precision.
This illustrative .NET 9 fragment records a bounded category and avoids putting operation IDs into the histogram's dimensions. The meter belongs to the application's lifetime. Export configuration and lifecycle integration are omitted, and the fragment has not been executed.
using System.Diagnostics;
using System.Diagnostics.Metrics;

static class ExportMetrics
{
    internal static readonly Meter Meter = new("Example.Export", "1.0.0");
    internal static readonly Histogram<double> Duration =
        Meter.CreateHistogram<double>("export.batch.duration", "s");

    internal static void Record(long startedAt, bool succeeded)
    {
        var tags = new TagList
        {
            { "outcome", succeeded ? "success" : "failure" }
        };
        Duration.Record(Stopwatch.GetElapsedTime(startedAt).TotalSeconds, tags);
    }
}
This is not a complete observability strategy. A duration histogram without a queue-age measurement cannot explain time spent waiting before export starts. A success count without a drop count can make a lossy exporter look healthy. Measurement boundaries should match the question, not the easiest place to insert a timer.
Design an experiment that could reject the hypothesis
To investigate monitoring overhead, state a falsifiable hypothesis. For example: a particular database poller materially increases tail latency under a defined workload. The candidate explanation is the poller, not observability in general.
Use an isolated environment with a representative dataset and request mix. Record runtime and package versions, database configuration, machine resources, warm-up policy and load-generator behavior. Keep an arrival pattern that does not silently reduce offered traffic when the service slows, or explicitly explain why a closed-loop workload represents the intended use.
Compare a minimal evidence baseline with the current monitoring configuration, then change one important factor at a time. Candidate factors include polling interval, query shape, trace sampling, log verbosity and exporter batch settings. Randomize or alternate the run order when environmental drift could dominate. Repeat enough runs to see variability instead of treating one convenient result as a property of the system.
Capture throughput, latency distribution, errors, timeouts, CPU, allocations, database waits, relevant memory behavior and telemetry loss. Explain which observation comes from an independent measurement path. If the only evidence comes from the instrumentation being removed, the comparison has a structural weakness.
Predefine practical acceptance criteria. A tiny latency difference might be irrelevant; a large loss of diagnostic coverage might be unacceptable. The experiment should decide a tradeoff, not merely produce a chart where one line is lower.
Measure the information you lose
03 / Watch the mechanism
Pressure can feed its own observer
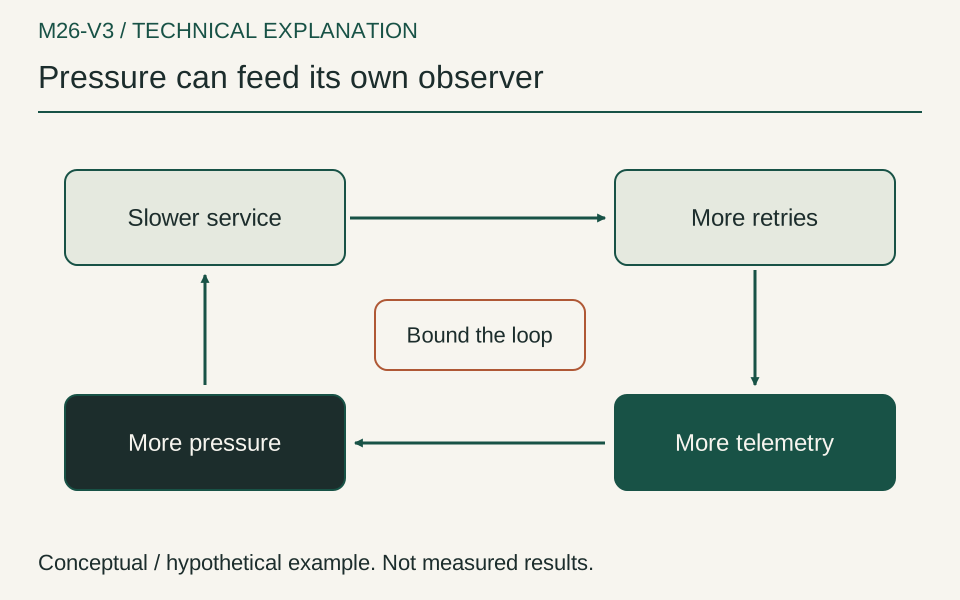
Static view. Play to see how the mechanism unfolds.
A hypothetical slow dependency causes retries, which create more observations and add resource pressure. The moving marker shows this reinforcing path; a retry bound or diagnostic budget can break it.
Interpretation and evidence
- The observer consumes shared resources.
- Bound attempts and diagnostic work.
- Preserve an independent health signal.
Reducing overhead is easy if the only goal is fewer bytes. Engineering requires preserving the questions that matter. Before changing sampling or disabling a diagnostic collector, write down the incidents it helps investigate and the evidence each investigation requires.
Use known fault scenarios in a safe environment: a slow dependency, a failed export, a duplicate delivery, an authorization rejection, an exhausted connection pool. Ask whether the reduced configuration still supports detection and diagnosis. Measure time to identify the relevant component, ambiguity between plausible causes and the ability to connect an operation to its attempts.
These are not perfectly objective scores. They can still be explicit enough to prevent a false economy. Saving telemetry cost while making the next incident impossible to reconstruct is a cost transfer, not automatically an improvement.
Sampling introduces selection effects. Head sampling can omit an interesting failure before its outcome is known. Tail sampling needs buffering and a decision path. Keeping every error can overrepresent repeated failures while losing successful context. State which population a chart describes and whether its sampling policy supports the inference being made.
Do not let a dashboard imply complete coverage when the pipeline has dropped data. Missingness is itself an operational fact. Showing a gap honestly is more useful than drawing a smooth line through an interval that the system did not observe.
When more detail is justified
The counterargument is strong: without rich diagnostics, teams can spend days guessing. An intermittent failure may require detail that a permanently minimal setup cannot provide. Reducing monitoring indiscriminately can make performance engineering slower and more expensive.
The answer is a controlled diagnostic mode. Give it a scope, an owner, an expiry and a budget. Target a component or bounded class of operations. Estimate the additional event rate before enabling it. Make its activation visible. Ensure that a temporary increase does not become the new permanent default through neglect.
For SQL Server, Extended Events provides another diagnostic mechanism, but its existence does not remove the need to choose events, predicates and targets carefully. A targeted session answers a question; indiscriminate collection creates another workload. Microsoft's Extended Events overview
Some evidence must remain durable even when diagnostics are reduced. Security decisions, externally meaningful actions and required business records need their own reliability design. A sampling change should never accidentally redefine what the organization can prove happened.
Give monitoring an operational contract
A useful contract says what the system records, what each signal means, which resources it may consume, and what happens when its destination disappears. It distinguishes aggregate measurements from diagnostic detail and durable business evidence. It names the questions that justify each expensive collector.
Review that contract when traffic grows, not only when a telemetry bill becomes surprising. A design that was harmless at a small scale can become intrusive because the number of operations, attributes or monitored databases has changed. Growth changes the arithmetic even when the code has not changed.
The final standard is demanding but practical: the observer should help us understand the service without becoming an uncontrolled competitor for its resources. We should be able to explain its cost, its blind spots and its behavior under stress. When we cannot, monitoring has become another production workload that we have not yet learned to operate.
Executed companion: two observers beside the same workload
The contemporary companion makes one part of this argument executable. It creates a real SQL Server database containing 100,000 synthetic rows and performs a bounded set of business lookups while a second connection either does no polling, reads metadata, or calculates a grouped aggregate over the table. The experiment was executed on 12 November 2026. It is separate from the article's historical design context and is not a reproduction of a customer incident.
The SQL engine is the same pinned SQL Server 2022 container used by the other database laboratories, version 16.0.4315.2. This fixture uses compatibility level 160, two container CPUs, a 4 GiB container memory limit and a 3072 MiB SQL memory setting. The client is a pinned .NET 9.0.4 process using Microsoft.Data.SqlClient 5.1.6. Image digest, source and execution records are included in the companion.
The synthetic table has an integer primary key, a status and an amount. Status is assigned by id % 4; amount is id % 1000 + 1. These rules produce an independent expected answer for every selected lookup and for every group in the aggregate observer. Correctness is not inferred from the absence of a database exception.
The business query is a parameterized point lookup by primary key. Each case executes256 lookups sequentially, choosing deterministic IDs spread through the table. The monitor uses its own connection, so its SQL can overlap with the business sequence. There is no background process that continues after the case ends. The harness waits for both paths and closes their connections.
This is a deliberately small experiment. It does not create a sustained arrival rate, multiple application instances or a production outage. Its purpose is to make observer work visible beside a fixed, verified business workload. The database is provisioned in a disposable container and removed after the run. No existing database or monitoring account is queried.
Different information requires different database work
01 / A concrete example
Two observers answer different questions
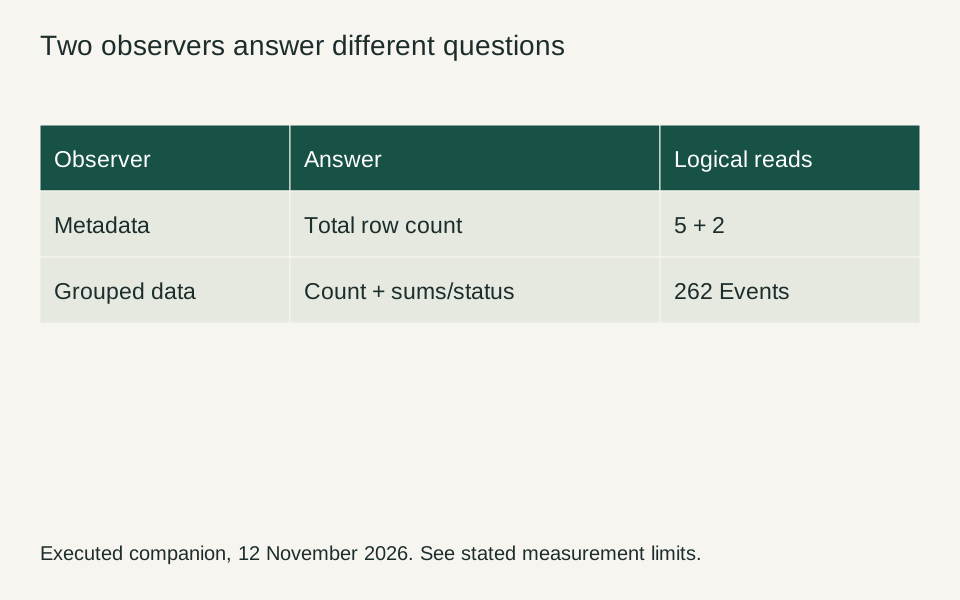
The queries produce different information. The greater page work is not automatically wasted if the aggregate supports a necessary decision.
Interpretation and evidence
- Define the diagnostic question.
- Do not equate logical reads with physical I/O.
- Retain independent result checks.
The metadata observer asks for a row count from sys.dm_db_partition_stats for the clustered index. The grouped observer asks for counts and amount totals by status. These are not interchangeable diagnostic answers. Calling the first query cheap and the second rich is a label for this fixture, not a general judgment that metadata monitoring is always better.
The executed SQL is:
-- Metadata observer
SELECT SUM(row_count)
FROM sys.dm_db_partition_stats
WHERE object_id = OBJECT_ID('dbo.Events')
  AND index_id = 1;

-- Grouped-data observer
SELECT Status, COUNT_BIG(*), SUM(CAST(AmountMinor AS bigint))
FROM dbo.Events
GROUP BY Status
OPTION (MAXDOP 1);
The grouped query can answer whether the distribution or aggregate amounts differ between statuses. The row-count query cannot. If that information changes an operational decision, the extra work may be justified. The experiment should expose the cost of obtaining it, not erase its purpose in order to declare the cheaper query the winner.
In the captured STATISTICS IO diagnostic, the metadata query reported five logical reads against sysrowsets and two against sysidxstats. The grouped query reported 262 logical reads against Events, with zero reported logical reads for its worktable and workfile entries. These are logical page-access observations from the recorded diagnostic executions. They are not physical storage reads, bytes transferred over a network, or a direct measure of elapsed time.
The fixture checks that the metadata answer is 100,000. It checks that the grouped answer contains four unique statuses, each with 25,000 rows, and verifies each amount sum against an independently calculated expected value. A monitor that returned the wrong aggregate would fail the run rather than become an example of fast observation.
The actual business query is also explicit:
SELECT AmountMinor
FROM dbo.Events
WHERE Id = @id
OPTION (MAXDOP 1);
Every returned amount is compared with the deterministic input rule. The checksum across256 lookups is124,472 in each accepted case. These checks keep the workload definition stable while the observer changes.
Bound the observer and preserve its ending
Each enabled observer performs exactly 16 polls. The harness uses a start gate to release the observer beside the business sequence, and records both lifetimes relative to a shared monotonic origin. Each SQL command has a bounded timeout; the case also has a finite overall deadline. The code awaits the poller in its cleanup path rather than letting a failed business request leave monitoring work behind.
The two endings are intentionally independent. A business sequence may finish while the observer is still scanning and aggregating. Conversely, a lightweight poller may finish early, leaving most later requests with no overlapping monitor work. A case labelled monitored does not imply that every one of its requests experienced the same amount of overlap.
The raw output therefore includes business_ms, poll_ms and overlap_ms. It also retains the individual request samples. This is more informative than a single elapsed number for the whole task, because a combined timer would hide whether the last work belonged to the application or to its observer.
There is an important limitation to the finite count. A production collector often runs on a schedule rather than issuing 16 polls consecutively. The laboratory is not an estimate of that collector's steady-state behavior. It is a bounded comparison of two known pieces of SQL while an independent point-lookup sequence runs. A different schedule needs a different experiment.
The experiment also does not force a database cache reset between cases. Schema setup and a diagnostic query happen before the measured comparisons. Alternating case order helps expose some sequence effects but does not create identical internal engine state. The entire run occurs on a shared developer host behind a local container boundary, which remains part of the result's conditions.
The observed times do not justify an outage story
02 / A concrete example
The observer can outlive the business workload
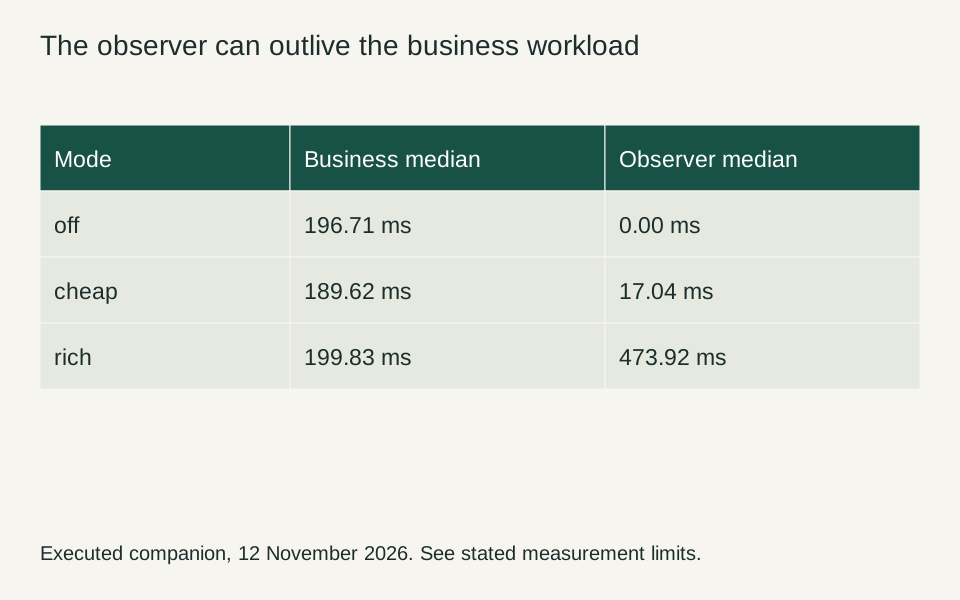
Business-time ranges overlap across modes. The clear local observation is extra observer work and a different ending, not proof of a production outage.
Interpretation and evidence
- Keep both endings.
- Show the full range in the article.
- Do not convert overlap into a causal speed claim.
Five rounds were run for each of the three observer modes. The order reverses on alternate rounds. The following table summarizes the actual recorded case durations and preserves the ranges. Each row represents the same 256 verified business queries; the enabled modes also complete 16 verified polls.
| Mode | Business median | Business range | Poll median | Poll range |
|---|---|---|---|---|
| off | 196.712 ms | 180.865–212.925 ms | 0.000 ms | 0.000–0.001 ms |
| cheap | 189.617 ms | 178.027–201.579 ms | 17.037 ms | 10.872–23.733 ms |
| rich | 199.827 ms | 185.725–206.297 ms | 473.924 ms | 462.703–498.795 ms |
The grouped observer clearly remains active much longer than the metadata observer in this fixture. Its poll lifetime is more than twice the duration of the business sequence in the observed cases. That is concrete work performed by the monitoring path. It does not disappear when the business timer stops.
The business times, however, overlap substantially across modes. There is no defensible claim from these 15 cases that the grouped observer caused a particular production slowdown, much less an outage. Some monitored cases finish sooner than some unmonitored cases. Preserving those observations is necessary to avoid mistaking the intended lesson for a measured causal result.
The request p95 recorded by the harness is the nearest-rank 95th percentile of 256 client-observed query-call durations within one case. It is not an SLA percentile across users, days or independent arrivals. Combining all samples into a single attractive number would hide the per-case schedule and the observer's ending. The raw case-level values are retained for readers who want to inspect them.
A particularly useful result is therefore negative: this bounded run did not isolate a reliable business-latency penalty. It did show that the two observers require different logical page work, answer different questions and have very different active lifetimes. That is enough to improve the next investigation without inventing a regression.
Turn the observation into a testable operational choice
Suppose the grouped query answers a question needed only during a suspected imbalance. Running it continuously at the same cadence as a basic health check may be unnecessary. The next design to test could keep the cheap observation frequent and activate the expensive one under a named condition. That proposal would need its own verification of detection behavior, not just a lower query count.
Alternatively, the grouped information may be required constantly. In that case, a maintained aggregate, a suitable index or an event-derived view might move the work elsewhere. The correct comparison must include the write or maintenance work introduced by that change. A fast read of a precomputed table is not free if every business update now performs extra bookkeeping.
These alternatives demonstrate why observer optimization starts with the diagnostic question. If nobody can name the decision enabled by a measurement, optimizing its query may preserve unnecessary work. If the decision is important, removing the query without replacing its evidence can make the system harder to operate even while its resource graph improves.
The same reasoning applies to exported traces and logs. Batching, sampling and queue limits can constrain resource use, but they change when or whether evidence arrives. A dropped diagnostic event and a lost business receipt are not interchangeable failures. The telemetry pipeline should never be the only durable record of an externally meaningful effect.
This companion intentionally uses read-only observer queries. It does not create a destructive maintenance action, change an index during the run or simulate a large denial of service. The difference between useful measurement and indiscriminate stress matters on shared machines. The finite workload was sufficient to expose the boundaries we wanted to study.
Reproduce the comparison without expanding its claim
Download the complete SQL observer laboratory and raw results. The source includes the provisioning rules, exact SQL, correctness assertions and bounded container runner. The runner generates its temporary database credential in memory and removes the uniquely named container in its cleanup path. Credentials and customer data are absent from the archive.
Reproduction needs the pinned SDK/runtime, Docker and the exact image digest recorded in the runner. check executes one round of the cases and validates the SQL answers. measure executes the five-round comparison. Provisioning and image acquisition are outside the measured query intervals. Keep those conditions when comparing a later run, or explicitly label what changed.
A follow-up intended to assess sustained monitoring pressure would require an independently specified arrival schedule, a longer observation window and measurements of the resources that might mediate the effect. It should preserve correct results and failure counts, not merely produce more queries until a dashboard looks dramatic. This article does not claim that such a follow-up has already been executed.
The useful habit is to give the observer the same scrutiny as another application dependency. What question does it answer? Which resources does it consume? When does its work end? What does it omit, and what happens when it cannot keep up? Those questions connect the monitoring design to evidence and prevent the monitoring system from becoming an unexamined explanation for everything else.
Historical versions and verification boundaries
These pins existed before the context date. Availability and static API checks do not establish a successful build or a production-safe patch level. Execution claims are limited to explicitly identified companion checks.
| Component | Version | Available by | Source |
|---|---|---|---|
| .NET SDK | 9.0.101 | 2024-12-03 | Primary record |
| .NET runtime | 9.0.0 | 2024-12-03 | Primary record |
| ASP.NET Core shared framework | 9.0.0 | 2024-12-03 | Primary record |
| C# | 12.0 | 2024-12-03 | Primary record |
| OpenTelemetry | 1.9.0 | 2024-06-14 | Primary record |
| SQL Server 2022 RTM | 16.0.1000.6 | 2022-11-16 | Primary record |