Same Service, Different Numbers: A Measurement Contract for .NET
A service can become faster in a benchmark and slower for its users. That sentence sounds like a paradox only if we assume that every performance number describes the same thing.
Explore the mechanism ↓
Reading tools Listen or translate
Read aloud
Uses an installed voice on your device.
Translate article
Machine translation. Code and evidence notes stay in English.
Original English text.
START WITH THE MECHANISM
Interactive companion and laboratory update: 12 November 2026. The editorial date places the topic on the timeline; this current explanation and its measured evidence retain their actual preparation and execution dates.
THE FULL INVESTIGATION
Same Service, Different Numbers: A Measurement Contract for .NET
Dates and technology context
This is a retrospective editorial timeline. Topic context: 10 June 2025. First publicly available: 12 November 2026. Current text, visuals and laboratory revisions were prepared on 12 November 2026.
Four accepted BenchmarkDotNet observations and five correctness fixtures were executed on 12 November 2026 with SDK 9.0.203 and runtime 9.0.4; preserve the rejected runtime-drift attempt.
A service can become faster in a benchmark and slower for its users. That sentence sounds like a paradox only if we assume that every performance number describes the same thing.
A method benchmark might exclude network travel, connection acquisition and queueing. An HTTP test might include those costs but omit the caller's retry policy. A dashboard might display the requests that completed while losing the requests that timed out. All three can be technically correct and collectively misleading.
The first task in performance work is therefore to define the statement we want a measurement to support. “This implementation is faster” is too incomplete to test. Faster at what, for whom, under which demand, and while preserving which behavior? A measurement contract makes those missing conditions explicit. It is a small agreement between the experiment and the decision that will follow it.
Start with the operation, not the stopwatch
Imagine an ASP.NET Core endpoint that returns a customer's recent orders. The endpoint looks simple, but the customer does not buy database round trips or JSON serialization. The customer wants a usable list that is sufficiently fresh and complete.
Before changing the implementation, define its observable behavior. Does it return ten orders or every order? Are cancelled orders included? Can the response use cached data? Does the caller need one consistent snapshot? A change that returns less information, uses older information or silently drops errors has changed the product contract. It may be a good change, but it is not a free performance improvement.
Write the acceptance statement in terms of outcomes. For example: at the selected offered load, authorized requests for the declared dataset must return the same ordered identifiers, with no increase in failed operations, while the chosen latency percentile improves. This is a proposed experiment, not a measured result. It gives correctness equal standing with speed.
The baseline for the illustrative examples is .NET 9. Its release introduced runtime and application improvements, but an improvement in the platform does not establish an improvement in a particular service. The release announcement establishes availability, not the result of our experiment. Microsoft's .NET 9 announcement.
Draw two boundaries before collecting one number
01 / See the idea
Two clocks, two different claims
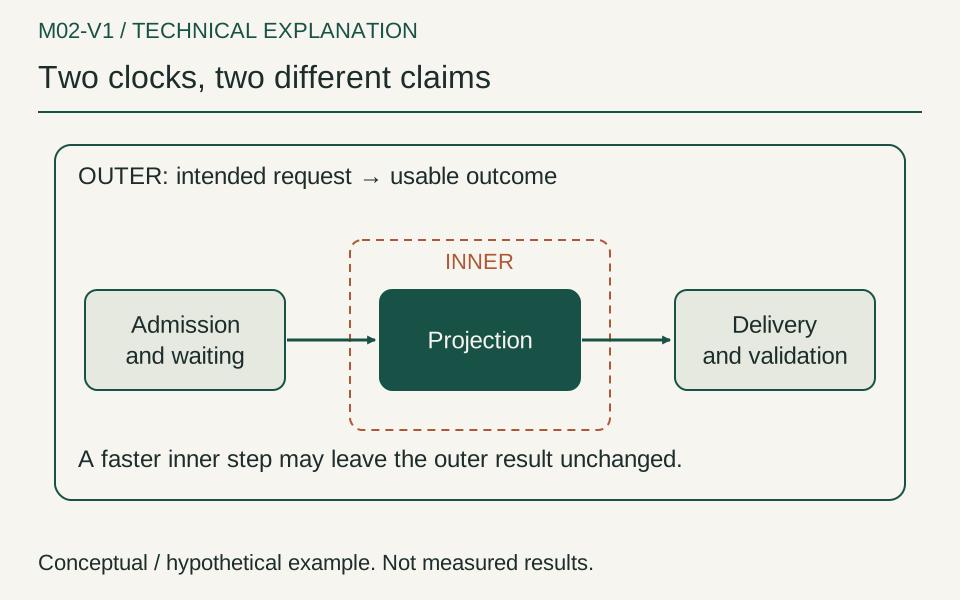
A hypothetical order lookup spends time in admission, projection and network delivery. Timing only projection can explain one mechanism but cannot establish the user-visible result.
Interpretation and evidence
- Keep the outer start fixed.
- Name what the inner timer excludes.
- Check correctness at the outcome boundary.
Use an inner boundary for implementation questions and an outer boundary for user experience. The inner boundary might surround a projection or serializer. The outer boundary starts when the load generator intends to issue a request and ends when it has a usable response or a terminal failure.
Those boundaries answer different questions. The first helps locate avoidable work. The second tells us whether removing that work matters. An allocation reduction in the inner boundary can be valuable even when network delay initially hides it. Conversely, it may be irrelevant if another dependency determines capacity.
Do not silently move the outer boundary between versions. If one run starts the clock after a connection is acquired and the other starts before, connection pressure becomes an apparent application regression. If one run counts a retried request as three operations while the other counts it as one, both throughput and failure rate change meaning.
Keep separate counts for business operations, transport attempts and successful responses. Suppose a hypothetical customer action produces three attempts and eventually succeeds. The customer experienced one operation, the server handled three requests, and the system consumed the resources of three attempts. None of those counts is a substitute for another.
Make the environment part of the result
A reproducible result needs more than a commit hash. Record the SDK and runtime versions, operating system, processor, available memory, container restrictions, garbage collector mode, database configuration, dependency versions and dataset generation seed. Include whether the process was cold or warmed and whether the database buffer pool was deliberately reset.
This is not ceremony. A different memory limit can alter runtime behavior. A different dataset can alter a query plan. A newly populated cache can make an apparently faster implementation look excellent for reasons unrelated to the code. The environment is an input to the experiment.
For the microbenchmark layer, pin BenchmarkDotNet to a known release rather than letting a floating package change the harness between runs. Version 0.14.0 provides a concrete historical baseline here. It is not a claim that this is the right version for every future project. BenchmarkDotNet 0.14.0 release.
The following fragment is illustrative and has not been compiled or executed for this manuscript. It compares a narrow transformation, not an HTTP service.
using BenchmarkDotNet.Attributes;
using BenchmarkDotNet.Running;

BenchmarkRunner.Run<ProjectionBenchmarks>();

[MemoryDiagnoser]
public class ProjectionBenchmarks
{
    private int[] _values = Array.Empty<int>();

    [Params(32, 4096)]
    public int Length { get; set; }

    [GlobalSetup]
    public void Setup() =>
        _values = Enumerable.Range(0, Length).ToArray();

    [Benchmark]
    public long SumSquares()
    {
        long total = 0;
        foreach (int value in _values)
            total += (long)value * value;
        return total;
    }
}
There is intentionally no “optimized” competitor yet. Establish what the harness observes before constructing an attractive comparison. Returning a result makes the operation meaningful to the benchmark. Moving data preparation into setup separates recurring work from fixture creation. Whether that separation matches production is another question we must answer explicitly.
Throughput is a relationship with demand
Completed requests per second does not tell us how many requests the system was offered. A service that completes everything at a low arrival rate has not demonstrated its capacity. A service that reports high completion throughput while rejecting a large fraction of requests has not demonstrated satisfactory user experience.
A useful load experiment records offered demand, accepted work, completed work, failures and outstanding work over time. The outstanding work matters because a queue can disguise overload. For a while, the service appears productive because it is still completing requests. Meanwhile, latency and retained state grow behind it.
Distinguish a fixed number of virtual users from a fixed arrival schedule. With a fixed user population that waits for each response, slow responses reduce the rate at which new requests arrive. The test can inadvertently give a struggling service a rest. An arrival schedule asks a different question: what happens when demand continues independently of response speed?
Neither model is universally correct. An interactive application may genuinely have users who wait. A queue consumer or external integration may receive work regardless of how slowly it responds. Choose the model that exposes the decision you need to make, and record where it differs from the real workload.
Percentiles need denominators and failure rules
02 / A concrete example
One operation, three attempts
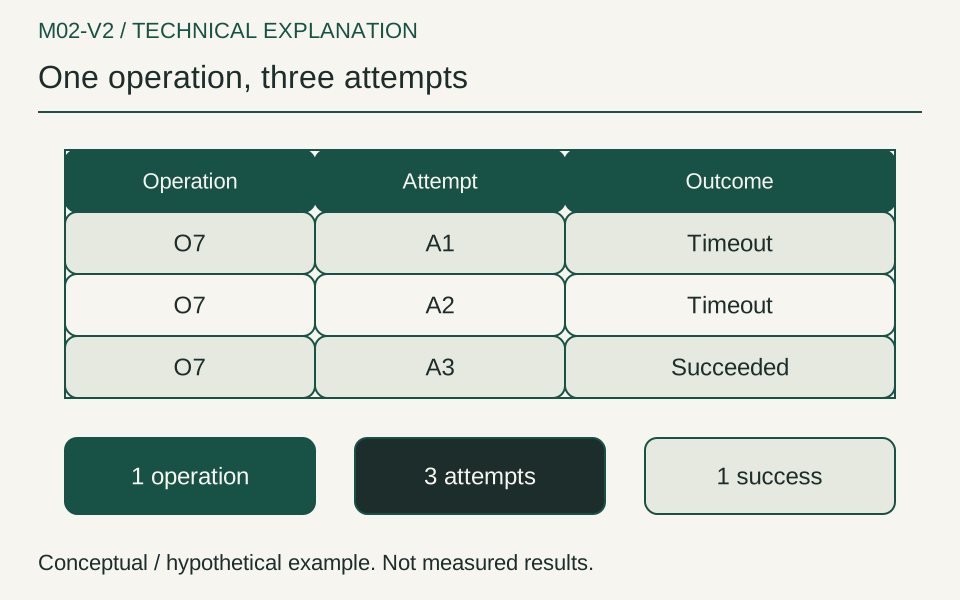
Suppose O7 times out twice and its third attempt returns the required orders. Count one successful operation and three attempts; reporting three operations would change the denominator.
Interpretation and evidence
- Operation count is one.
- Attempt amplification is three.
- Timeout attempts stay in the evidence.
An average hides variation, but adding a p99 does not automatically make a report rigorous. State which observations entered the distribution. Are cancelled requests included? Are retries separate? Are timeouts recorded at their timeout duration or excluded because they never produced a successful response?
For an interactive operation, a timeout is not missing data. It is an outcome. Report the latency distribution of successful operations alongside the proportion and duration of unsuccessful ones. Avoid combining them into a beautiful single curve that makes failure disappear.
Also preserve the time dimension. A single percentile over a long run can hide a short period of severe degradation. Plot shorter windows and show when load changed, when the process warmed, and when a dependency was deliberately disturbed. Tail latency often becomes interesting precisely when the system changes state.
The small arithmetic model below is a definition, not a benchmark. It prevents ambiguous claims by keeping operations and attempts distinct.
operation_success_rate = successful_operations / started_operations
attempt_amplification  = transport_attempts / started_operations
completion_throughput = completed_operations / observation_seconds

Report unfinished operations separately at the observation boundary.
Do not label them successful because the test process stopped waiting.
An apparent throughput gain that comes with higher attempt amplification may increase cost elsewhere. A faster successful path can coexist with a worse completion rate. The contract should say which combinations would justify shipping the change.
Allocations explain a mechanism, not the whole experience
Allocated bytes are useful because they describe pressure created by execution. They are not the same as retained memory, process working set or a memory leak. An allocation can be short-lived. A small allocation can be retained indefinitely. Native buffers can consume memory outside a managed allocation counter.
That distinction changes how we investigate. If the claim is about reducing per-request allocation, a focused benchmark may support it. If the claim is about surviving an hour of backlog without exceeding a container's memory boundary, the experiment must include retained state, queue depth, collection behavior and the rest of the process.
Instrumentation itself also belongs in the environment record. OpenTelemetry provides a standard route for collecting observations, but the existence of a standard does not imply that its collection, processing and export are cost-free. Record the enabled instrumentation and collection settings for every compared run. An exact package baseline is easier to inspect than a floating dependency. OpenTelemetry .NET 1.9.0 package.
Use a profiler to explain a measured change after you have a trustworthy symptom. A profiler can reveal where allocations occur or where execution spends time. It does not choose the business objective for you. That objective must come from the operation contract.
Design the comparison so it can disagree with you
03 / Watch the mechanism
Waiting can hide overload
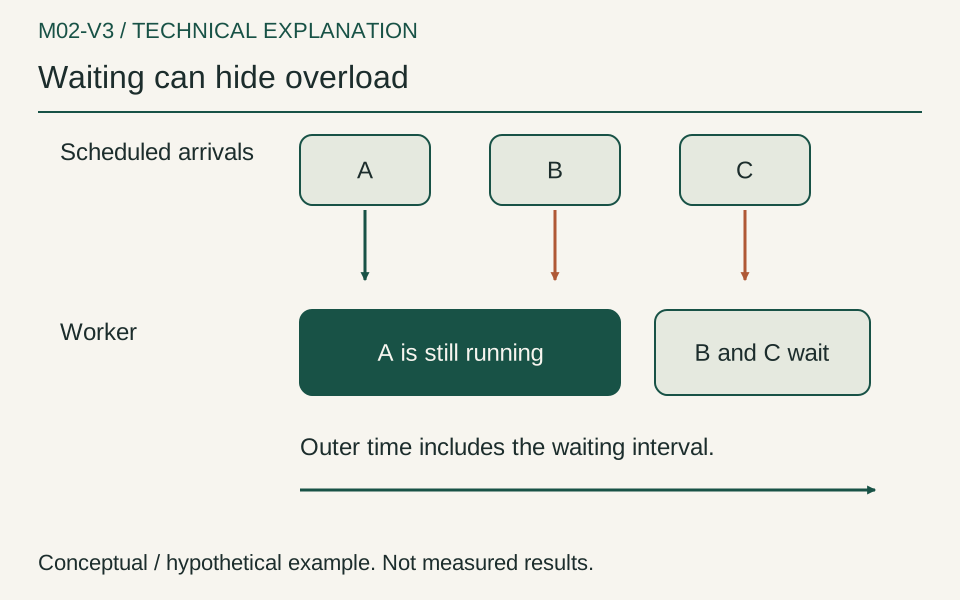
Static view. Play to see how the mechanism unfolds.
In this hypothetical sequence, requests B and C arrive while A occupies the worker. Their waiting belongs to the outer boundary even though the projection timer has not started.
Interpretation and evidence
- Arrival time is not worker start.
- Outstanding work is an outcome to report.
- Motion shows order, not measured speed.
Before running the candidate, write down the conditions that would reject it. Perhaps allocation falls but database CPU rises. Perhaps median latency improves but cancellation becomes unreliable. Perhaps throughput improves only for a tiny uniform dataset while the real distribution contains a few unusually large customers.
Use multiple dataset shapes that correspond to real uncertainty: small and large responses, hot and cold keys, successful and failing dependency calls, balanced and skewed tenants. Do not multiply scenarios merely to accumulate charts. Every scenario should challenge a premise that could change the decision.
Alternate baseline and candidate runs when possible, rather than running every baseline first and every candidate later. Keep enough repeated runs to expose ordinary variation. Preserve individual results instead of publishing only the best one. If you cannot distinguish the change from noise, that uncertainty is a result, not an embarrassment.
Review correctness independently. Compare outputs against an expected fixture, not merely against whatever the previous implementation happened to return. A candidate that repeats an existing bug is not vindicated by agreement. For a data endpoint, check identifiers, ordering, authorization boundaries and missing records before discussing milliseconds.
Publish the decision, not just the chart
The final artifact should let another engineer understand both the observation and its limits. Include the workload definition, environment manifest, scripts, raw measurements, correctness checks and the reason the result matters. Record unsuccessful attempts and interruptions without presenting them as completed runs.
A good conclusion might say that a change reduced a narrow allocation cost, while the end-to-end experiment showed no reliable latency improvement at the tested load. That can still justify the change if the code is simpler or the allocation reduction provides useful headroom. It should not be advertised as a faster user experience.
Sometimes the correct decision is to stop optimizing. If the suspected code accounts for a small part of the operation and the intervention makes the system harder to maintain, more tuning may be poor engineering. Sometimes the correct decision is to change the operation itself, perhaps by paging a result or moving expensive work out of an interactive path. Those are product decisions with performance consequences.
The measurement contract keeps these choices honest. It connects a number to the work it describes, the conditions under which it was observed and the decision it can support. Without that connection, performance becomes a competition between screenshots. With it, even a disappointing result teaches us how the system actually behaves.
A reproducible check of the inner boundary
The principles above now have a small executable companion. It was prepared and run on 12 November 2026; that is the execution date, not a claim that this measurement existed in June 2025. The companion deliberately uses .NET SDK 9.0.203, runtime 9.0.4 and BenchmarkDotNet 0.14.0, versions that were available before this article's historical context. This is a historical reproduction baseline, not advice to deploy an old runtime patch today.
The experiment asks one narrow question: what changes when a synchronous sum-of-squares operation borrows an existing array rather than first taking a private copy? It does not claim to compare two complete order services. No database, HTTP client, network, authentication or retry policy is present in the timed boundary. That simplicity is useful only because we say exactly what was removed.
The input consists of the integers from zero to Length - 1. Both variants return the same long result and leave the input unchanged. The independent oracle is the closed-form sum of squares, n * (n - 1) * (2 * n - 1) / 6. Correctness checks use lengths zero, one, 32 and 4096, plus a separate signed input [-3, -1, 0, 2], whose expected result is 14. These are five input fixtures, not five independent performance trials. The checks passed under the pinned runtime before the measurements were accepted.
Here is the actual operation used by the companion, with its ownership decision visible:
public static class Kernels
{
    public static long WithOwnedCopy(int[] values)
    {
        int[] copy = values.AsSpan().ToArray();
        return Sum(copy);
    }

    public static long BorrowedView(int[] values) => Sum(values);

    private static long Sum(ReadOnlySpan<int> values)
    {
        long total = 0;
        foreach (int value in values)
            total += (long)value * value;
        return total;
    }
}
The copy is intentionally explicit. It represents a caller choosing to own separate storage for the duration of this operation. The borrowed variant removes that allocation and copy because the fixture guarantees that the original array remains available and is not concurrently modified. We are not claiming to have discovered an optimizer trick that makes ownership unnecessary. We have changed an implementation decision under a stated input-lifetime contract.
That difference matters when translating the example to a service. If another component can modify the array while we compute, the borrowed operation might no longer observe a coherent input. If the computation must outlive the owner, returning the original buffer to a pool early creates a different correctness problem. The two implementations are comparable in this fixture because its synchronous, immutable-input conditions make both results valid. Outside that boundary, copying may be doing necessary work.
What the measured numbers actually support
The accepted BenchmarkDotNet run executed four benchmarks: two implementations at two input lengths. It used one process launch per benchmark, three warmup iterations and five measurement iterations, with a target iteration time of 150 milliseconds. The machine reported an AMD EPYC 7502P, 32 physical cores and 64 logical processors, Windows build 10.0.20348.5870, and X64 RyuJIT with AVX2. The benchmark worker and its host both reported .NET 9.0.4.
These are observations from a shared development host. Other task benchmarks were serialized, but unrelated operating-system and application activity was not controlled. The experiment is short enough to be practical during development; it does not establish a fleet-wide effect, a stable production capacity or the distribution of individual request latency.
| Operation | Input length | Mean time per operation | Managed bytes per operation |
|---|---|---|---|
| Own a copy, then sum | 32 | 34.81 ns | 152 B |
| Borrow the input, then sum | 32 | 21.87 ns | No allocation reported |
| Own a copy, then sum | 4096 | 3486.78 ns | 16408 B |
| Borrow the input, then sum | 4096 | 2710.22 ns | No allocation reported |
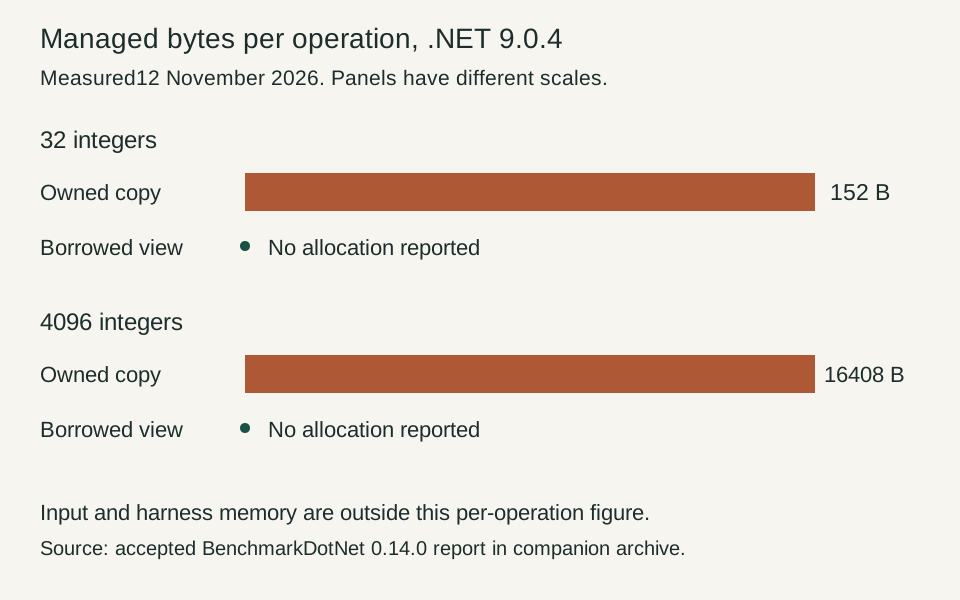
The chart and table describe the same accepted run. The horizontal scale in the chart is managed bytes per operation; time is reported separately. A zero-length allocation bar means that MemoryDiagnoser reported no managed allocation for the measured operation. It does not mean the process used no memory. The input array already exists, the runtime and harness consume memory, and the measurement cannot be used as a total-process memory statement.
For the 32-element case, the mean for borrowing is about 37 percent lower in this run. For the 4096-element case, it is about 22 percent lower. The useful conclusion is not the percentage itself. Removing the copy removes a specific amount of managed allocation and reduces the work inside this synchronous boundary. That is the mechanism we intended to test, and the results are consistent with it. The larger operation still has to read every element and calculate the sum.
The mean is not a p95 or p99 for service requests. BenchmarkDotNet invokes the method repeatedly inside measurement iterations, then analyzes those observations. A request-level tail distribution requires a different collection boundary and an arrival model. Reporting the mean from this table as a service latency guarantee would be a category error, even if the printed number were accurate to several decimal places.
There is also no end-to-end speedup claim here. If this transformation occupies a small part of a request dominated by connection acquisition or storage latency, its local improvement may be almost invisible to the user. Conversely, allocation reductions can become relevant at scale even before they visibly improve a single lightly loaded request. Either possibility is a reason to conduct the next experiment, not a result that this experiment already proves.
The first run was rejected for a useful reason
The initial attempt exposed a real failure of the experiment setup. The project that launched BenchmarkDotNet was pinned to .NET 9.0.4, but the generated benchmark worker ran on .NET 9.0.23. That newer runtime was installed on the same machine. The host banner alone would have made the setup look correct; the worker banner showed that the measured execution used a different patch.
Those results are retained in the downloadable evidence under rejected-runtime-drift. They are not the source of the table above. The correction was to pin the runtime framework version of BenchmarkDotNet's generated project and disable runtime roll-forward for the worker. The accepted run then reported 9.0.4 for both host and job. Keeping the rejected evidence explains why there are two runs without inviting the reader to select whichever one produces the more appealing result.
The companion uses an explicit toolchain rather than assuming that its application's runtime configuration governs a separate generated project:
var toolchain = CsProjCoreToolchain.From(
    new NetCoreAppSettings("net9.0", "9.0.4", ".NET 9.0.4 pinned"));

var job = Job.Default
    .WithToolchain(toolchain)
    .WithEnvironmentVariable("DOTNET_ROLL_FORWARD", "Disable")
    .WithLaunchCount(1)
    .WithWarmupCount(3)
    .WithIterationCount(5)
    .WithIterationTime(TimeInterval.FromMilliseconds(150));

BenchmarkSwitcher.FromAssembly(typeof(Program).Assembly).Run(
    args, ManualConfig.Create(DefaultConfig.Instance).AddJob(job));
The relevant NetCoreAppSettings constructor accepts the target framework and runtime framework version as separate arguments. Its implementation is available in the BenchmarkDotNet 0.14.0 source. That source establishes what the configuration means; the generated worker's output establishes which runtime actually executed. Both pieces are needed.
This is a useful lesson beyond benchmarks. A test host, child process, command-line tool and application can all run different versions on one machine. A global.json file constrains SDK selection, but it is not a universal description of every runtime process an experiment starts. Record the process that performs the work, not merely the tool that launches it.
Reproduce the result, then challenge the boundary
Download the complete measurement companion and raw evidence. The archive includes the source, pinned project, correctness mode, accepted reports and rejected initial attempt. No credentials or production data are required. The input is generated locally.
From the companion's lab directory, with the specified SDK and runtime available, run the correctness mode first:
dotnet run --project MeasurementContract.csproj -c Release -- --verify
Then execute the benchmark selection:
dotnet run --no-build --project MeasurementContract.csproj \
  -c Release -- --filter "*" --artifacts ../evidence/reproduced
Compare the worker's runtime banner with the intended version before interpreting the table. Keep the generated reports and environment record with the source revision. If the machine cannot provide the pinned runtime, the right outcome is a failed reproduction attempt with a clear reason. Quietly moving to another runtime answers a different question.
There are several productive ways to challenge this experiment. Add a case in which ownership really requires a copy and explain why borrowing is then invalid. Use a different input distribution while preserving the same expected result. Move data preparation inside the timed boundary to answer a total-cost question, but keep that result separate from this recurring-operation measurement. Run a real request scenario with a declared arrival schedule if the decision concerns user experience. Each extension should name the new question and the evidence needed to answer it.
The next optimization should be chosen by the remaining uncertainty. There is no justification here for adding unsafe code, pooling every input or replacing all arrays with a more complicated abstraction. The experiment has established that a particular copy is optional under a particular ownership contract. Removing it is understandable, reviewable and easy to test. That is already a useful engineering result.
A stronger performance article is not one that promises a larger speedup. It is one in which the reader can trace the path from a claim, through code and a valid comparison, to the measured evidence and the limit of the conclusion. The rejected worker version is part of that path. So are the immutable-input precondition and the distinction between zero reported allocation and zero memory use. Those details are what make the result reusable rather than merely impressive.
Historical versions and verification boundaries
These pins existed before the context date. Availability and static API checks do not establish a successful build or a production-safe patch level. Execution claims are limited to explicitly identified companion checks.
| Component | Version | Available by | Source |
|---|---|---|---|
| .NET SDK | 9.0.101 | 2024-12-03 | Primary record |
| .NET runtime | 9.0.0 | 2024-12-03 | Primary record |
| ASP.NET Core shared framework | 9.0.0 | 2024-12-03 | Primary record |
| C# | 12.0 | 2024-12-03 | Primary record |
| BenchmarkDotNet | 0.14.0 | 2024-08-06 | Primary record |
| BenchmarkDotNet.Annotations | 0.14.0 | 2024-08-06 | Primary record |
| OpenTelemetry | 1.9.0 | 2024-06-14 | Primary record |