

Consider an order service whose memory graph climbs through the afternoon. The allocation profile ranks System.String and byte[] at the top. One pull request swaps new byte[] for ArrayPool<byte>.Shared, another proposes waiting for .NET 11 because the JIT removes allocations now, and a third adds a cache for the strings. Each change answers a real question. None of them starts by asking which question the graph is asking.
The question most engineers arrive with is short: is my .NET service allocating too much, leaking, or just slow, and which change will actually help? It has no single answer, because "memory" covers several different mechanisms with different tools and different fixes. This guide draws the map. Six deep dives on DevInside each measured one part of it with a solution you can download and run; here their numbers sit side by side, and every section ends with the article to read next for the question you have.
- "Memory" hides four questions: where objects are created (allocation), who can still reach them (retention), how long reused storage is held (the lease), and whether any of it costs time. Each tool answers exactly one of them.
- Fewer bytes is not less time. Cutting a report's allocation by 74% left its median at 10.6 ms; the JIT keeping a 24-byte box off the heap took a call from 12.8 to 1.7 ns. GC pause time, not the allocation ranking, tells you which case you are in.
- Growth is a retention question. Follow the strong path from a GC root to the object and cut the edge you own. A measured leak ran fewer collections and a lower p95 than the fixed service, so latency will not reveal it.
- Pooling and zero-copy parsing trade allocation for ownership. They paid for 64 KB buffers and lost for 59-byte buffers passed between threads, and returning a buffer too early sent 93.5% of 64 KB orders with another order's bytes.
Four questions hide behind one memory graph
Start by sorting the symptom, because the tools are not interchangeable. An allocation question asks where objects were created during an interval and how many bytes that cost: GC.GetAllocatedBytesForCurrentThread around a call, BenchmarkDotNet's memory diagnoser, or an allocation profiler. A retention question asks why a particular object is still reachable when you expected it gone: the heap size after a full collection, dotnet-gcdump for which types dominate, dotnet-dump with gcroot for the path that keeps one instance alive.
The third question is easy to miss. A pooled array, or a slice of pipe memory, is never garbage: it is leased. The bytes in use are the arrival rate times how long each lease lasts, and no allocation counter shows them. The fourth question is the one the business cares about: does any of this cost time? That is answered by GC pause time, collection counts and CPU, measured on the path a user waits for.
Process counters answer none of the four precisely. In the payload-retention measurements, a retained 16 MiB array whose pages were never written left the working set at 20.6 MB against a 20.0 MB baseline, while the GC's own heap size read 16.80 MB. GC.GetTotalAllocatedBytes() read 16.81 MB both while the array was retained and after it was released, because it is cumulative and never goes down. Working set and private bytes are a second look at memory the operating system gave the process, for every reason at once.
An object's life decides what it costs
Where does an allocation go, and who decides how expensive it is? Two parts of the runtime decide. The JIT decides first whether the object needs the heap at all. If it does, the garbage collector's generations decide how often anyone pays to look at it again.
The cheapest object never reaches the heap. The expensive one is still reachable.
- The whole cast. Your source asks for an object or a box; the JIT and the garbage collector decide where it lives and how often anyone looks at it again.
- If no reference escapes the method, the JIT can place the object in the stack frame. On .NET 11 the
int?box in the escape-analysis lab went from 24 bytes to 0 this way. - Everything else starts in gen0. Allocation there is cheap; a collection runs when the gen0 budget is used up, and most objects are already dead by then.
- Survivors are promoted to gen1 and gen2. Arrays of 85,000 bytes or more skip gen0 and go to the large object heap, which is collected only with gen2.
- An object in gen2 stays as long as a strong path from a GC root reaches it. That is retention: 110.3 MB after a full collection in the leaky export service.
- A pooled array never becomes garbage at all. It is rented and returned for the life of the process, so the cost moves from the GC to whoever owns the lease.
Generations and the large object heap as described in Microsoft's GC fundamentals; escape analysis as described in the .NET 10 runtime notes and dotnet/runtime#122167. Measured values from the escape-analysis and payload-retention solutions on .NET 11.0.0.
The garbage collector's own documentation puts the cost model in one sentence: the frequency and duration of collections are "the result of the volume of allocations and the amount of survived memory" (GC fundamentals). Allocation volume decides how often gen0 fills up. Survival decides how much work each collection does and how often the expensive gen2 collections come. An object that dies young is cheap; an object that lives just long enough to be promoted is the expensive kind.
The JIT decides first
Escape analysis lets the JIT put an object in the method's frame when it can prove no reference outlives the call. The .NET 10 runtime notes state the rule: an object escapes when it is assigned to a non-local variable or passed to a function the JIT does not inline. .NET 9 applied it to boxes, .NET 10 added small arrays, objects held in local struct fields and delegates, and .NET 11 expanded the boxing of Nullable<T> into ordinary code, which made those boxes visible to the analysis. Closures still go to the heap.
Three limits matter in practice. First, only optimized code is analysed: a Debug build and Tier0 code keep the heap box, so a measurement taken in the first seconds of a process counts allocations that Tier1 code will later remove. Second, the box stays on the heap whenever a reference reaches a call the JIT did not inline, such as Counter<int>.Add, or an address handed to a struct's instance method, which is why the Guid? box stayed at 32 bytes while a decimal? box of the same size dropped to zero. Third, zero bytes is not zero work: the decimal? formatting hole lost its box and gained only 4.7 ns, from 59.8 to 55.1 ns, because formatting a decimal dominates the call.
The GC sizes its own budget
The collector adjusts its thresholds as the process runs. When it sees a high survival rate in a generation, it raises that generation's budget, because collecting would free little. That one rule explains a result that looks backwards: in the payload-retention load run, the leaking service ran 2 collections over 400 requests while the fixed one ran 33, and the leaking service had the lower p95. The GC mode moves the same dials. In the measurement-contract runs, server GC with DATAS ran 479 gen0 collections in 12 s with 2.8% pause time and a 72 MB peak working set; without DATAS it ran 63 with 0.4% pause and 120 MB. The steady p99 was 0.85 against 0.71 ms. Same latency class, very different memory.
Read this next: The allocation that disappears: escape analysis from .NET 10 to .NET 11 reads the JIT's machine code on both runtimes and measures thirteen cases, including the ones that did not change.
Measure first, and say which process you measured
A .NET process is not the same program in its first seconds as it is a minute later. In the measurement-contract lab, a fresh ASP.NET Core service under 4 clients served roughly 7,000 requests a second at a p50 near 0.5 ms for about six seconds while its pricing path ran Tier0 code. Once Tier1 code arrived, the same process served 20,893 a second at a p50 of 0.16 ms. The first 1,000 requests had a p99 of 4.11 ms; the warmed run, 0.85 ms. All of these numbers are correct, and each answers a different question.
For memory work this matters twice. Allocation counts depend on the window too, because escape analysis only runs in optimized code. And runtime knobs change the memory picture directly: the GC mode, DATAS and the processor count the runtime sees. On a 64-core host, a server-GC process without DOTNET_PROCESSOR_COUNT could use up to 64 heaps instead of the 4 a small container would give it. A number is only comparable with what produced it, so write that down with the number:
- The window. Start-up, first request, first N requests or steady state, reported separately. Warm past Tier1 before steady-state numbers, and check it in the JIT counts or the per-second timeline.
- The knobs. Every
DOTNET_variable the process saw, the GC mode and the processor count. Debug builds keep heap boxes the Release build removes. - The result. An expected answer computed independently of the code under test. In the performance-diagnostic lab, a
LIMIT 10candidate did the least work of all and returned 10 rows instead of 60; only the result check kept it off the chart. - The spread. Bytes per call are exact and reproducible: the escape-analysis lab got the same bytes to the byte from three different harnesses. Time is not: the measurement-contract default configuration's steady maximum was 83.9, 48.5 and 8.7 ms in three runs. Report p50, p95, p99 and max, and repeat each configuration at least three times.
Read this next: Same service, different numbers measures one service in six runtime configurations, three rounds each, and shows the JSON report its harness writes next to every number.
Fewer bytes is not less time until the GC says so
The allocation profile is usually the first chart anyone opens, and it is accurate about what it records. The trap is reading it as a time profile. Across the six deep dives, every change below removed bytes. How much time did each one save?
Every change cut bytes. Time fell sharply once and rose twice.
| Change (deep dive) | Bytes after / before | Time after / before |
|---|---|---|
| Report, unused column | 0.26 | 0.99 |
| int? box, .NET 11 | 0 | 0.13 |
| decimal? box, .NET 11 | 0 | 0.92 |
| Pool, 64 KB orders | 0 | 0.83 |
| Pool, 59 B, two threads | 0.91 | 2.40 |
| Borrow, split 4 KB | 0 | 1.57 |
- Bytes per operation after the change, relative to before. Four changes removed all or nearly all of it; the report fix removed 74%; the small pooled orders saved 8 bytes.
- Time per operation on the same scale. The
int?box (12.8 to 1.7 ns) and the 64 KB pool (mean 21.6 to 17.9 µs) got faster. - Here the bytes went and the time stayed. A table scan held the report at 10.6 ms; formatting a decimal dominated the second call.
- Here time went up. Renting across threads searched the pool's per-core stacks, and decoding split 4 KB payloads field by field cost more than one copy.
Ratios derived in this guide from the published deep dives (two decimals; ratios below 0.01 shown as 0, such as 106.6 of 65,560.3 B for the 64 KB pool): report p50 with one client, 10.645 to 10.575 ms, 29,944 to 7,784 B; NetCents and the decimal? audit hole, BenchmarkDotNet means on .NET 10.0.15 against .NET 11.0.0; pooled pipeline, mean of 64 KB orders and p50 of 59-byte orders; borrow against copy, BenchmarkDotNet mean for 4 KB payloads in 4 KB segments. All on Windows Server 2022, AMD EPYC 7502P, a shared machine.
The report row is the instructive one. In the performance-diagnostic lab, an invoice report's allocation profile ranked System.String first with 63.7% of the allocation ticks: an audit note the report never returned. Removing it cut allocation per request from 29,944 to 7,784 bytes and moved nothing: the one-client p50 went from 10.645 to 10.575 ms. A trace under 8-client load showed why. The GC had paused the process for 0.44% of wall-clock time, so cutting allocation by 74% could at best recover a fraction of 0.44%. The time was in a full table scan, 59,999 scan steps per request to return 60 rows, and a covering index took the 8-client p50 from 30.835 to 0.300 ms.
Allocation does cost time when the GC's own numbers say so. In the buffer-ownership lab, the unpooled pipeline for 64 KB orders ran 781 gen0 and 164 gen1 collections with 366.9 ms of pause over 100,000 orders; pooling removed all of them, and the mean moved by 3.7 µs per order, almost exactly the pause per order. In the PipeReader lab, copying every 256-byte reading ran 836 gen0 collections in 5 s on a loopback feed against 1 for borrowing, and delivered fewer readings: 4.86 against 5.62 million a second. So the order of reading is fixed: GC pause time and collection counts first, from dotnet-counters or the trace; the allocation ranking second, to find who produces the bytes once you know they cost something.
Read this next: What a performance diagnostic should deliver runs the invoice report under a thread-time sampler, an allocation profiler and the runtime counters, and shows what each one records and which explanation survives.
When memory grows, find the owner, not the allocator
A heap that keeps growing after full collections is not an allocation problem. Something still references the objects, and the question is who. A GC root is a starting point for the collector's trace: static fields, locals on a thread's stack, CPU registers, GC handles and the finalization queue. Anything reachable from a root survives; a managed leak is a strong path nobody meant to keep.
In the payload-retention lab, an export service subscribed each per-request job to a process-wide branding feed and never unsubscribed. gcroot on .NET 11 walked the chain from a strong handle through the statics array, the feed, the multicast Action<string> and its Delegate+Wrapper[] to a single delegate whose _target field was the job. That field is the edge the code created with +=, and the one to cut: cutting the edge closest to the object you own removes every path that runs through it.
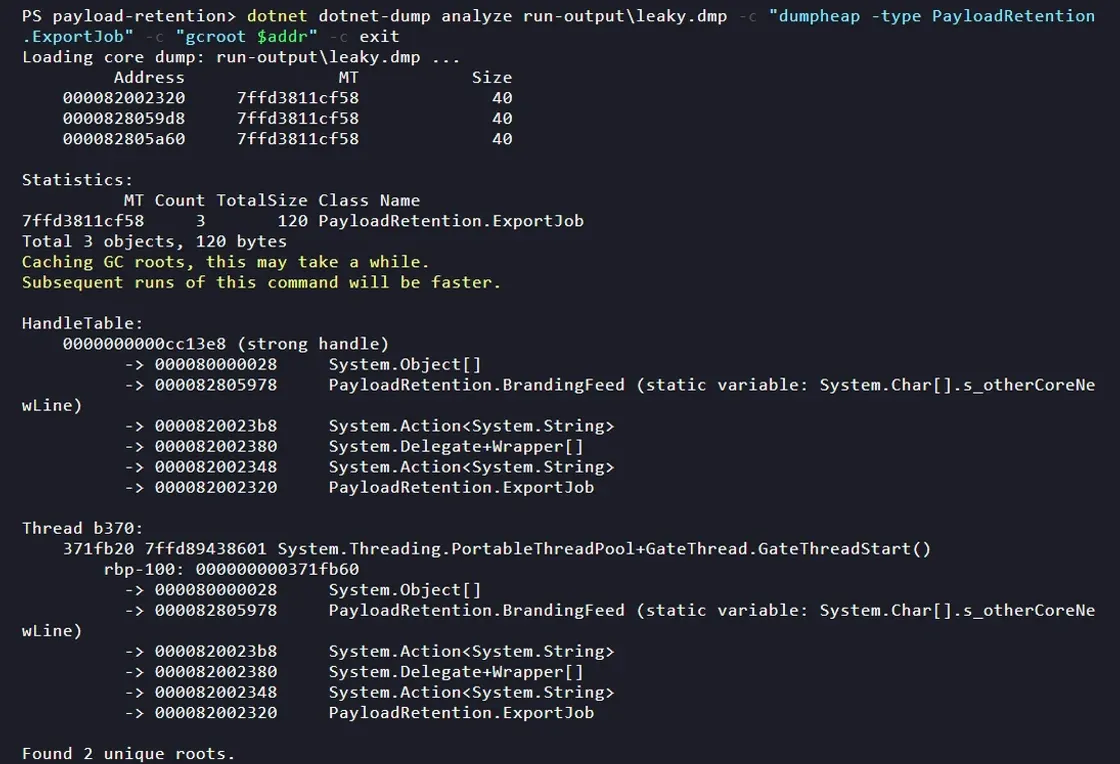
dumpheap finds the three held jobs and gcroot walks from a strong handle through BrandingFeed, Action<String> and Delegate+Wrapper[] to the job (.NET 11.0.0).The leak is hard to see from the usual dashboards. Over 400 requests of 256 KiB, the leaking service had a p95 of 141.0 µs against 210.4 µs for the fixed one, because the GC raised its budget and ran 2 collections instead of 33. The GC's "heap size at last collection" lagged the leak by hundreds of requests. What did show it: the live heap after a full collection, 110.3 MB against 0.1 MB, and the subscriber count, which grew by exactly one per request. Three more lessons from the same lab generalize:
- Look for a second owner. After the handler was removed, the job was still alive because the upload queue held it as accepted work. Queues, timers, closures, cancellation registrations, caches and cleanup lists all qualify.
- Disposed is not released. A registration that unlinked from the feed but kept its callback field still owned the job for as long as a cleanup list kept the registration.
- Trust addresses over labels. The name
gcrootprinted for the static root was wrong in one of two runs; the chain of addresses, checked withdumpobj, was right in both.
The proof of a fix is the object being gone after the point where it should be: a test with a WeakReference probe after a full collection, created inside a non-inlined helper so the test itself does not keep the object alive.
Read this next: Allocation or retention: follow the reference that still owns the payload walks that path with dotnet-gcdump, dotnet-dump, Visual Studio and dotMemory, and builds a subscription that unlinks and drains safely.
Pooling and zero-copy turn an allocation into a lease
When the allocation does cost time, the usual fixes are a pool or a view over memory someone else owns. Both remove the allocation by keeping storage alive longer than one use. That changes the question from "how many bytes" to "what event proves the last reader has stopped".
The buffer-ownership lab shows what happens when nobody answers it. An order gateway rented each body from ArrayPool<byte>.Shared, queued a ReadOnlyMemory<byte> over it, and returned the array in a finally once the order was queued. ReadOnlyMemoryContent reads its view only when the request is written, and on one thread the pool hands the array you just returned to the next renter. Under load, 93.5% of bulk orders left with another order's bytes. No exception, no corrupted memory, just the wrong customer's order.
The shared pool's design explains both the speed and the risk. Reading SharedArrayPool in .NET 11: sizes are powers of two, so 65,537 bytes rent 131,072; Rent tries the calling thread's slot, then per-core stacks of up to 32 arrays each, then allocates; Return never clears unless asked and never detects a second return. On the 64-core test machine the pool kept 2,049 arrays per size (64 stacks of 32 plus one thread slot) and trims them after gen2 collections. When rent and return run on the same thread, the slot makes pooling fast. When they run on different threads, as in a producer and consumer pipeline, the slot rarely helps.
That is the line between paying and not paying. For 64 KB orders the owned, pooled pipeline cut allocation from 65,560.3 to 106.6 bytes per order and every collection with it. For 59-byte orders rented on one thread and returned on another, it raised the median from 838 to 2,015 ns per order and saved 8 bytes. Even on one thread, BenchmarkDotNet put a pooled 59-byte body at 43.1 ns against 38.3 ns for new byte[]. Pool large buffers; measure small ones in the pipeline they really run in.
Zero-copy parsing has the same shape. With System.IO.Pipelines, a payload sliced from ReadOnlySequence<byte> is a borrow that ends at AdvanceTo: in the PipeReader lab a view kept past it decoded as the next reading, turbine 8 instead of turbine 7. And a pipe's memory bound is not its pause threshold. With a 1,024-byte threshold the pipe still held a whole 65,534-byte frame, because the threshold counts unexamined bytes, not retained ones. The real bound is the maximum frame size times the number of connections: 64 KB frames on 10,000 connections can hold about 655 MB. Borrowing also has a CPU price: decoding 4 KB payloads field by field across segments cost 1.57 to 1.86 times a copy, while copying only the split payloads into one reused buffer cost 0.60 to 0.77 and allocated nothing.
Both labs end at the same rule. Every leased buffer has one named owner and one event that ends the lease; nothing returns storage while a queued view, a lazy request body or a pending task can still read it; and the memory budget comes from admission in bytes or a frame limit, not from queue slots or pipe thresholds. By Little's law, 100 orders a second holding 64 KB each for 5 s during a downstream outage keep 31.25 MiB in use while allocating nothing per order.
Read this next: Pooling without illusions reproduces the foreign order deterministically and repairs it with an explicit ownership transfer; Parsing without unnecessary copies builds a framed reader that survives every segment split and measures copy, borrow and flatten.
The measured numbers, side by side
Every number below is quoted from the published deep dive named in the first column, which takes it from its solution's results/ folder. All runs were on Windows Server 2022 x64 with an AMD EPYC 7502P (64 logical processors), a shared machine, on .NET 11.0.0 unless the row says otherwise. Allocations are exact; times move between runs, so compare within a row, not across articles.
| Deep dive | What was measured | Result |
|---|---|---|
| Escape analysis | Bytes per call of the int? type test, .NET 10.0.15 against 11.0.0 | 24 B to 0 B |
| Escape analysis | Same call, BenchmarkDotNet mean | 12.8 ns to 1.7 ns |
| Escape analysis | Whole audit line; with Guid? unwrapped | 88 B to 32 B; 56 B to 0 B |
| Escape analysis | Metrics tag and attribute bag, both runtimes | 24 B, unchanged |
| Payload retention | Live heap after a full GC, 400 exports of 256 KiB, leaky against fixed | 110.3 MB against 0.1 MB |
| Payload retention | Collections and p95 latency over the same requests | 2 and 141.0 µs against 33 and 210.4 µs |
| Payload retention | Working set with a retained 16 MiB array, written against untouched | 37.4 MB against 20.6 MB |
| Buffer ownership | Allocated per 64 KB order, unpooled against owned and pooled | 65,560.3 B against 106.6 B |
| Buffer ownership | Mean per 64 KB order; GC pause over 100,000 orders | 21.6 to 17.9 µs; 366.9 ms to 0.0 ms |
| Buffer ownership | p50 per 59-byte order, rent and return on different threads | 838 ns to 2,015 ns |
| Buffer ownership | Orders sent with foreign bytes, early return, 64 KB | 93.5% |
| Pipe frames | Allocated per 256-byte reading on the loopback feed, copy against borrow | 280.0 B against 0.03 B |
| Pipe frames | Readings per second and gen0 collections in 5 s, same run | 4.86 and 5.62 million; 836 against 1 |
| Pipe frames | Borrow and flatten of 4 KB payloads across segments, relative to copy | 1.57 to 1.86; 0.60 to 0.77 |
| Pipe frames | Bytes held by a pipe with a 1,024-byte pause threshold | 65,534 B |
| Performance diagnostic | Allocated per report request, before and after dropping the unused column | 29,944 B to 7,784 B |
| Performance diagnostic | One-client p50, same change; GC pause share under load | 10.645 to 10.575 ms; 0.44% |
| Performance diagnostic | 8-client p50 and throughput, covering index | 30.835 to 0.300 ms; 251 to 25,406 requests/s |
| Measurement contract | Cold against steady p50 and p99, default configuration | 0.48 / 4.11 ms against 0.16 / 0.85 ms |
| Measurement contract | Steady requests/s, default against tiering off | 20,893 against 10,295 |
| Measurement contract | Gen0 collections, pause and peak working set, DATAS on against off | 479, 2.8%, 72 MB against 63, 0.4%, 120 MB |
Read down the result column and the pattern of this guide shows up in the data: allocations moved in every deep dive, time moved where the GC or the replacement mechanism said it would, and the two problems that would hurt production most, the leak and the foreign order, made the service faster, not slower.
Read this next: one deep dive per question
- "Will upgrading to .NET 11 remove my allocations?" Read The allocation that disappears. You get the JIT listings on both runtimes, thirteen measured cases and a solution that runs them; the key finding is that nullable boxes that stay local drop to zero while boxes passed to calls the JIT does not inline stay.
- "Memory keeps growing. What holds it?" Read Allocation or retention. It walks a
gcrootpath field by field, with IDE snapshots and a draining subscription; the key finding is that the leak lowered latency and showed only in the heap after a full collection. - "Should I use ArrayPool here?" Read Pooling without illusions. It reproduces the foreign-order bug with the real shared pool, probes the pool's internals and measures the whole pipeline; pooling paid for 64 KB buffers and cost time for small ones across threads.
- "How do I parse a stream without copying every message?" Read Parsing without unnecessary copies. It tests every segment split of a frame and measures copy, borrow and flatten on a loopback feed; flattening only the split payloads was cheapest for large frames.
- "The profiler blames allocations. Is it right?" Read What a performance diagnostic should deliver. It compares what each profiler records on one endpoint and writes down the deliverable; a 74% allocation cut changed no percentile, while an index removed both the time and the queue.
- "Why do my numbers differ from my colleague's?" Read Same service, different numbers. It measures tiering, PGO, ReadyToRun and three GC modes in fresh processes and shows the report its harness writes; the GC settings barely moved p99 and changed memory by two thirds.
If the time turns out to be waiting rather than work, finding the queue in an ASP.NET service is the next step, not a memory change.
Decision guide: from symptom to first move
| What you see | First move | What not to do yet |
|---|---|---|
| A type at the top of the allocation profile | Read GC pause time and collection counts under realistic load; only a measurable pause makes the allocation worth fixing for speed | Rewrite the hot path because the ranking says so |
| Heap after full collections grows over hours | Take a dotnet-gcdump, then gcroot one survivor and read the fields on the path | Add a pool, a cache or GC.Collect |
| Working set or private bytes climb, heap does not | Check the GC's heap size and committed memory, then native memory and pooled storage | Treat it as a managed leak |
| A small box or closure on a path called millions of times | Release build, warmed past Tier1, bytes per call on both runtimes; read the JIT listing for allocation helpers | Assume .NET 11 removed it, or force inlining everywhere |
| Large buffers (tens of KB) allocated per request, with gen0 and gen1 pauses | Pool them behind an owner object with one event that ends the lease | Return the buffer when it is queued instead of when it is read |
| Small buffers passed between threads | Measure the whole pipeline; plain allocation often wins | Pool by reflex |
| Copying every message from a socket or pipe | Borrow the slice, copy only what outlives the call, flatten split payloads if you decode them field by field | Keep a view after AdvanceTo |
| Two runs or two people disagree | Write down window, knobs, load, machine, result check and spread; run each configuration three times | Average a cold run with a warm one |
Checklist
- Name the question first: allocation, retention, lease or time. Pick the tool that answers that one.
- Pin the expected result before any timing, and check every candidate against it.
- Measure Release code in a named window, warmed past Tier1 for steady state, with every runtime knob recorded.
- Report p50, p95, p99 and max with the sample count, and repeat each configuration at least three times.
- Read GC pause time and collection counts before acting on an allocation ranking.
- For growth, watch the heap after a full collection and find the owner with
gcrootor a retention view; check for second owners. - Prove a retention fix with a weak-reference test, not with a falling graph.
- Give every pooled or borrowed buffer one owner and one event that ends the lease; bound memory in bytes, not in queue slots.
- Keep allocation guards in tests (bytes per call, plans, counters), not timing thresholds.
Further reading
- Fundamentals of garbage collection: roots, generations, survival and the large object heap.
- The large object heap: the 85,000-byte threshold and when it is collected.
- What's new in the .NET 10 runtime: escape analysis for arrays, struct fields and delegates.
- dotnet/runtime#122167: inlined nullable allocators in .NET 11.
- Dynamic adaptation to application sizes (DATAS): how server GC sizes heaps and budgets.
- Debug a memory leak in .NET:
dotnet-counters,dotnet-dumpandgcroot. - Memory<T> and Span<T> usage guidelines: owners, consumers and leases.
- System.IO.Pipelines: reader and writer rules and backpressure.