

Series How .NET Runs Your Code, part 3 of 11. Previous: Part 2, when a method becomes machine code. Next: Part 4, ReadyToRun and the code the JIT can replace.
Lena’s diagnostic calls Drain once to process 500 batches. Before it returns, the .NET 11 just-in-time compiler (JIT) has compiled a second body for it. In part 2 Dana watched the first call change where the next call would go. Here the batch is still in progress. Where could the new code begin without repeating an iteration?
Suppose the fictional Intake team sees its worker’s CPU stay high after a deployment. Ravi proposes TieredCompilation=false, which would prevent later promotion. Lena wants to change less. If the worker keeps promotion but turns off dynamic profile-guided optimization (PGO), what changes in the rule loop, and what would justify keeping that setting?
- A frequently called method can acquire several machine-code bodies in one process. Its call count alone cannot tell you which body served a particular request.
- A running loop can enter optimized code before the method returns. A profile can also change how an interface call dispatches inside that loop.
- Disabling tiering removes both opportunities. Use a first-call listing to inspect code and two separate measurements to decide whether to change the image.
A single invocation can acquire optimized code mid-loop
Open src/Part03.Tiers/Program.cs at the call to Drain. In the paced case it runs 500 batches with 64 repetitions each. Every repetition checks 0, 1,023, 1,024 and 1,025 bytes through the rule and then through Fits directly. Each path accepts the first three sizes. The expected total is therefore 500 × 64 × (3 + 3) = 192,000. What state would the runtime need to carry forward if it changed code during batch 300?
The JIT can first produce a quick version, called Tier0. On-stack replacement (OSR) lets a loop running that version continue in optimized code. The quick body can contain a patchpoint on a loop back edge, where execution returns for another iteration. Reaching it repeatedly gives the runtime a place to transfer the active invocation to code compiled for that location. The current locals and progress through the loop must survive. A call to the C# method does not start over. How can you distinguish that transfer from another call at the top?
An OSR body has an entry inside the original loop
- The driver calls Drain once. A frame holds the accepted count and both loop indices while the quick body processes the four payload sizes.
- The loop returns to its back edge many times without a second call to Drain. Entry counting cannot see those individual iterations.
- The quick body reaches a patchpoint. The runtime can prepare an optimized continuation associated with that location in the original method.
- Execution transfers with the state required at that offset. The iterations already processed remain in the acceptance total.
- The continuation completes the remaining batches. The driver checks its returned count against the answer derived from the four fixed inputs.
The saved Mac listings in results/mac/part03 provide the continuation header and final count. The drawing illustrates state transfer. The exact transfer iteration was unobserved.
In the Mac .NET 11 listing, search for Program:Drain. Its first version is Instrumented Tier0. The later version says Tier1-OSR and OSR variant for entry point 0x41. That offset identifies a place in the method’s IL, the portable instructions emitted by the C# compiler. It does not identify batch 300 or any particular iteration. The result batches=500 accepted=192000 independently checks the completed calculation. To locate the transfer in a particular iteration, you would need to observe execution as well as compilation. The OSR path can compile on the thread at the patchpoint. Ordinary entry promotion uses a background worker. OSR patchpoints and continuations.
With ordinary entry promotion, a frequently called helper can use a new body the next time control enters it. Fits runs inside the loop and is called repeatedly. What changes between its first and later bodies?
The first body preserves work the second can erase
Read the suffix in the listing header. Tier1-OSR on Drain points into an active loop. Tier1 on Fits identifies a body that a later call can enter at the beginning.
Take PayloadPolicy.Fits(int bytes, int limit). It returns the result of a signed, inclusive comparison. Its NoInlining annotation keeps the method visible in both runs. First, call the policy with the runtime defaults. Repeat in a fresh process with tiering disabled. Both runs accept 1,024 bytes. What does quick code give up to run that first call?
The optimized comparison keeps both arguments in registers
; Assembly listing for method Intake.Core.PayloadPolicy:Fits(int,int):bool (Tier0)
stp     fp, lr, [sp, #-0x20]!
str     w0, [fp, #0x1C]
str     w1, [fp, #0x18]
ldr     w0, [fp, #0x1C]
ldr     w1, [fp, #0x18]
cmp     w0, w1
cset    x0, le
ldp     fp, lr, [sp], #0x20
ret     lr
; Total bytes of code 40

; Assembly listing for method Intake.Core.PayloadPolicy:Fits(int,int):bool (FullOpts)
stp     fp, lr, [sp, #-0x10]!
cmp     w0, w1
cset    x0, le
ldp     fp, lr, [sp], #0x10
ret     lr
; Total bytes of code 24- The first listing is Tier0. The first store saves the frame pointer and return address. The next two copy the incoming arguments to stack slots.
- The two loads recover the values just stored. The comparison and condition code implement the inclusive limit that the worker actually needs.
- FullOpts is the first and only compilation with tiering disabled. It compares the incoming registers directly and sets the Boolean result.
- The optimized body still restores its frame and returns. Removing the argument spills leaves 24 bytes of instructions in this Arm64 build.
Excerpts from defaults-once.asm and no-tiering-once.asm under results/mac/part03. Frame setup details and labels are omitted.
If you are reviewing a listing, follow the two arguments into the comparison. Counting every stack instruction together would hide the difference between saving the return address and spilling an argument.
Return to the paced four-size run. How many headers does Fits acquire in the same process? A quick body and an optimized body would suggest two.
Three separate launches on each runtime and platform gave the same sequence for this method. The figures below give the native body size in bytes, with one column per observed listing. On both systems the middle listing is a separate compiler invocation, even where it has exactly the same length as the first.
| Receiver and runtime | Fresh runs | Tier0 | Instrumented Tier0 | Tier1 |
|---|---|---|---|---|
| Mac Arm64, .NET 10.0.15 | 3 | 40 B | 40 B | 24 B |
| Mac Arm64, .NET 11.0.0 | 3 | 40 B | 40 B | 24 B |
| Windows x64, .NET 10.0.15 | 3 | 24 B | 24 B | 9 B |
| Windows x64, .NET 11.0.0 | 3 | 24 B | 24 B | 9 B |
In the final Arm64 listing, the JIT reports No PGO data for this tiny method. Profile-guided optimization (PGO) lets the compiler use observations from previous executions. Seeing an instrumented tier does not guarantee useful profile data at every site. What decided when the next body was installed?
Why a call threshold cannot predict request 31
Think about the first job after an instance starts. Loading its settings, parsing its input and writing its first response may each reach methods that have never run here. Having the optimizer compete with every one of those first calls would spend processor time before the runtime knows what the service will keep doing.
The runtime therefore treats a burst of new methods as startup-like activity. The retail .NET 10 and .NET 11 settings use a call-count threshold of 30 and a delay of 100 ms on a typical multiprocessor instance. The implementation can defer installing the counters during that delay, and extend it when more methods start running. Calls made in that interval need not count toward promotion. What must happen before a later caller can use optimized code?
Call 31 has no promised code version
- The first call reaches the quick body. A new instance also has many other methods entering managed code for the first time.
- More first entries keep the startup delay active. This method can continue serving callers while the runtime defers installing call counting.
- After a quiet interval, the runtime can enable counting on eligible entries. Which calls came before that point depends on the rest of the process.
- Enough counted entries make a method eligible for promotion. A method can continue executing its existing body while work waits for the compiler.
- The runtime obtains another body, using instrumentation and optimization as appropriate. Separate compilations can have identical native code sizes.
- Subsequent entries can use the installed version. A caller needs an observation from its own run to identify the body it reached.
Illustrative method-entry sequence from CoreCLR’s call-count and tiering implementation. The observed headers are in paced-1.asm under results/mac/part03.
One job may enter a helper several times. Another may bypass it altogether. Even a perfect count of completed requests therefore tells Dana little about when the optimizing compiler picked up this particular method. Runtime promotion implementation.
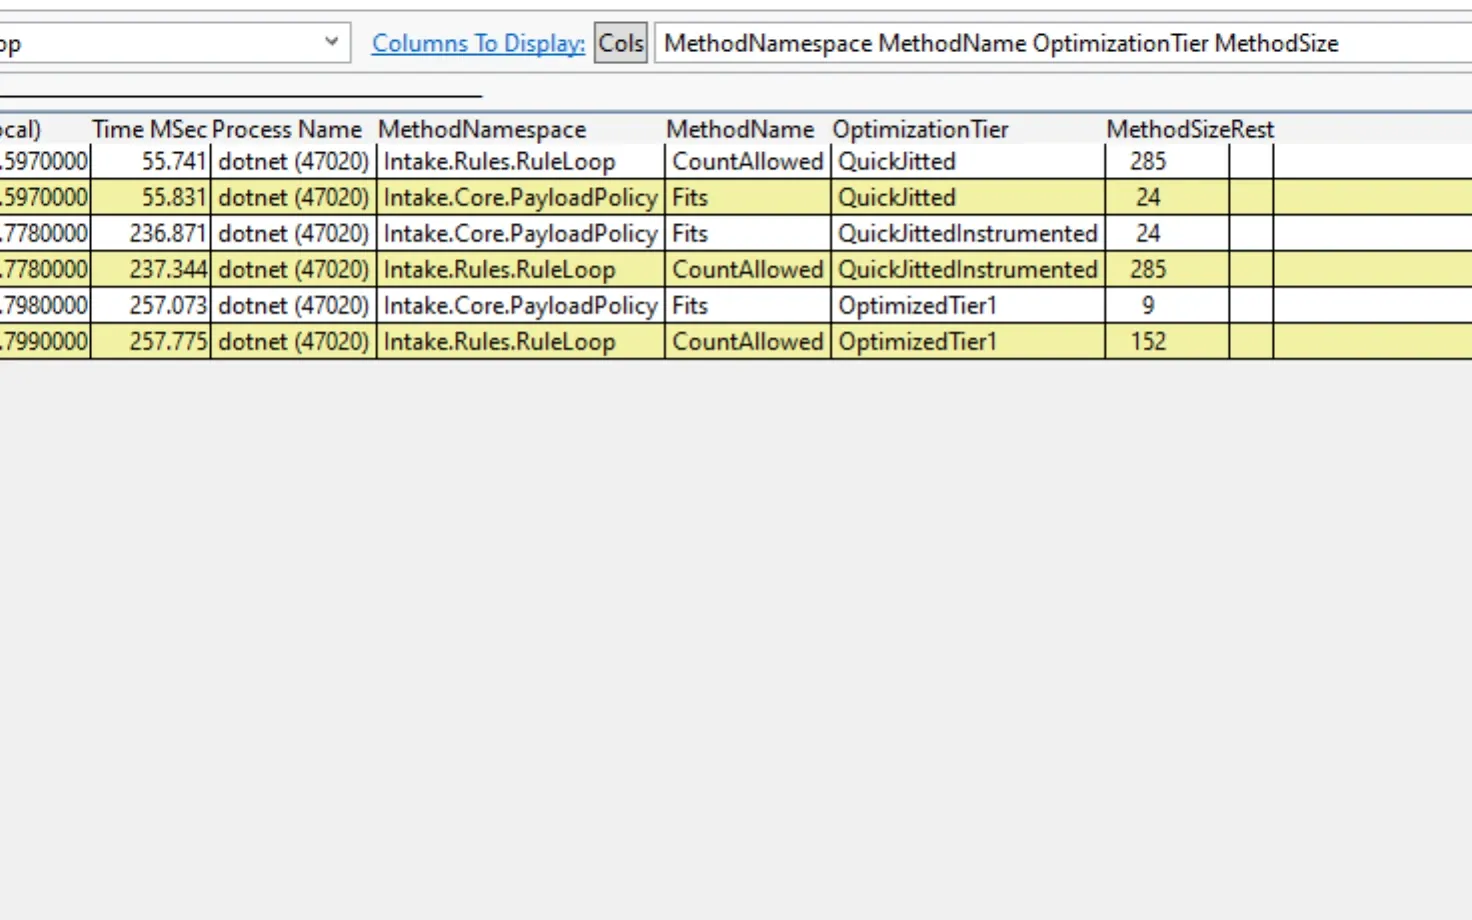
Fits and CountAllowed down the OptimizationTier column. Both acquire an instrumented body before their optimized body appears.A type guard can specialize the common rule and still accept another
Call counts tell Lena which method became hot. They leave another question open: in rule.Allows(bytes), which implementation did the caller usually need? The parameter is an IPayloadRule. The concrete object receiving the call is its receiver. In the recorded run every receiver came from PayloadRule.FromLimit(1024). Its Allows method invokes a stored delegate, a callable object that implements the chosen rule.
Dynamic profile-guided optimization (PGO) records observations such as the concrete types seen at a call site. They guide a later compilation. A profile dominated by PayloadRule gives the JIT a reason to specialize for that type, but the interface still permits others. Predict the result of changing the configured limit from 1,024 to 2,048. Has the type receiving the call changed?
The guard checks the rule’s type before choosing how to call it
// Tier1 · profiled · CountAllowed · Arm64
G_M000_IG13:
    ldr     x0, [x19]
    cmp     x0, x23
    bne     G_M000_IG16
    ldr     x2, [x19, #0x08]
    ldp     x0, x2, [x2, #0x10]
    blr     x2      // code for System.Func`2[int,bool]:Invoke(int):bool:this

G_M000_IG16:
    blr     xip0      // code for Intake.Rules.IPayloadRule:Allows(int):bool:this

// Tier1 · TieredPGO disabled · same inputs
blr xip0 // code for Intake.Rules.IPayloadRule:Allows(int):bool:this- The load reads the receiver’s type. The compare uses the expected type in x23. A mismatch jumps to the general call.
- A match lets this path use the known wrapper implementation. The delegate still runs, so its captured limit still decides the answer.
- A different implementation would take this fallback and dispatch through IPayloadRule. The captured run exercised one receiver type.
- With dynamic PGO disabled, the optimized loop retains the interface call. Both versions return the same accepted count.
From paced-1.asm and paced-no-pgo.asm under results/mac/part03. The excerpts omit register setup and loop bookkeeping. The alternative receiver is hypothetical.
FromLimit(2048) would create another PayloadRule with a different delegate. The type check would still match, and the delegate would apply the new limit. A different class implementing IPayloadRule would take the fallback even if its policy happened to accept exactly the same sizes. The full listing has another type test before a specialized loop. The excerpt at IG13 shows the available branches. Their execution frequencies and hardware prediction outcomes are separate observations.
Would switching off PGO lower CPU after deployment?
For Ravi’s hypothetical CPU ticket, the download supplies a controlled comparison. On each receiver, Lena keeps its published .NET 11 diagnostic fixed. She runs 500 batches with the defaults, then runs the same inputs in a fresh process with only DOTNET_TieredPGO=0. Each process accepts the same 192,000 checks across the helper and direct policy. If the result is identical, what did that one switch change?
PGO adds a guarded path on both receivers without changing the answers
On a narrow screen, swipe left or use the right arrow key to see the call paths. Bytes of RuleLoop.CountAllowed machine code, from the paced listings in results/mac/part03 and results/win/part03. The accepted-check count includes the rule and the direct comparison.
On the M3 the profiled body uses a compare and bne. On the EPYC it uses a compare and jne. Both can reach the stored delegate on a type match and both retain an interface fallback. With PGO off, both still reach Tier1 and call IPayloadRule.Allows through the interface. Neither instruction length nor the total of correct answers measures the CPU spent per verified job. Dynamic PGO and guarded devirtualization.
Compare process CPU per verified job before and after the deployment, with the same job mix. A higher total CPU reading may simply mean more completed jobs. Changes in dotnet.jit.compiled_methods locate compilation activity. If cost per job remains high, sample stacks during that interval. Do they lead into the rule, the XML writer or the compiler?
If the rule is implicated, repeat the production mix with PGO on and off on the same quiet receiver. Change the image only if the candidate meets the first-job deadline and reduces CPU per correct job in the later window. Until that trial, Dana leaves PGO enabled. The shorter PGO-off listing establishes a different call path, with its CPU cost still open.
The project file and the running process have different jobs
Ravi has two places to make his proposal. A project property travels with the app when the SDK writes its runtime configuration. An environment variable travels with the process launcher or the base image. The same dynamic-link library (DLL) can therefore produce different listings on two machines. Read the SDK output beside the launch environment before treating a difference as a runtime regression.
Here is the option from the example MSBuild import. Beside it is the one matching entry from the generated intake-worker.runtimeconfig.json. The other entries describe the frameworks the worker requires.
<Project>
  <PropertyGroup>
    <TieredCompilation>false</TieredCompilation>
  </PropertyGroup>
</Project>
"System.Runtime.TieredCompilation": false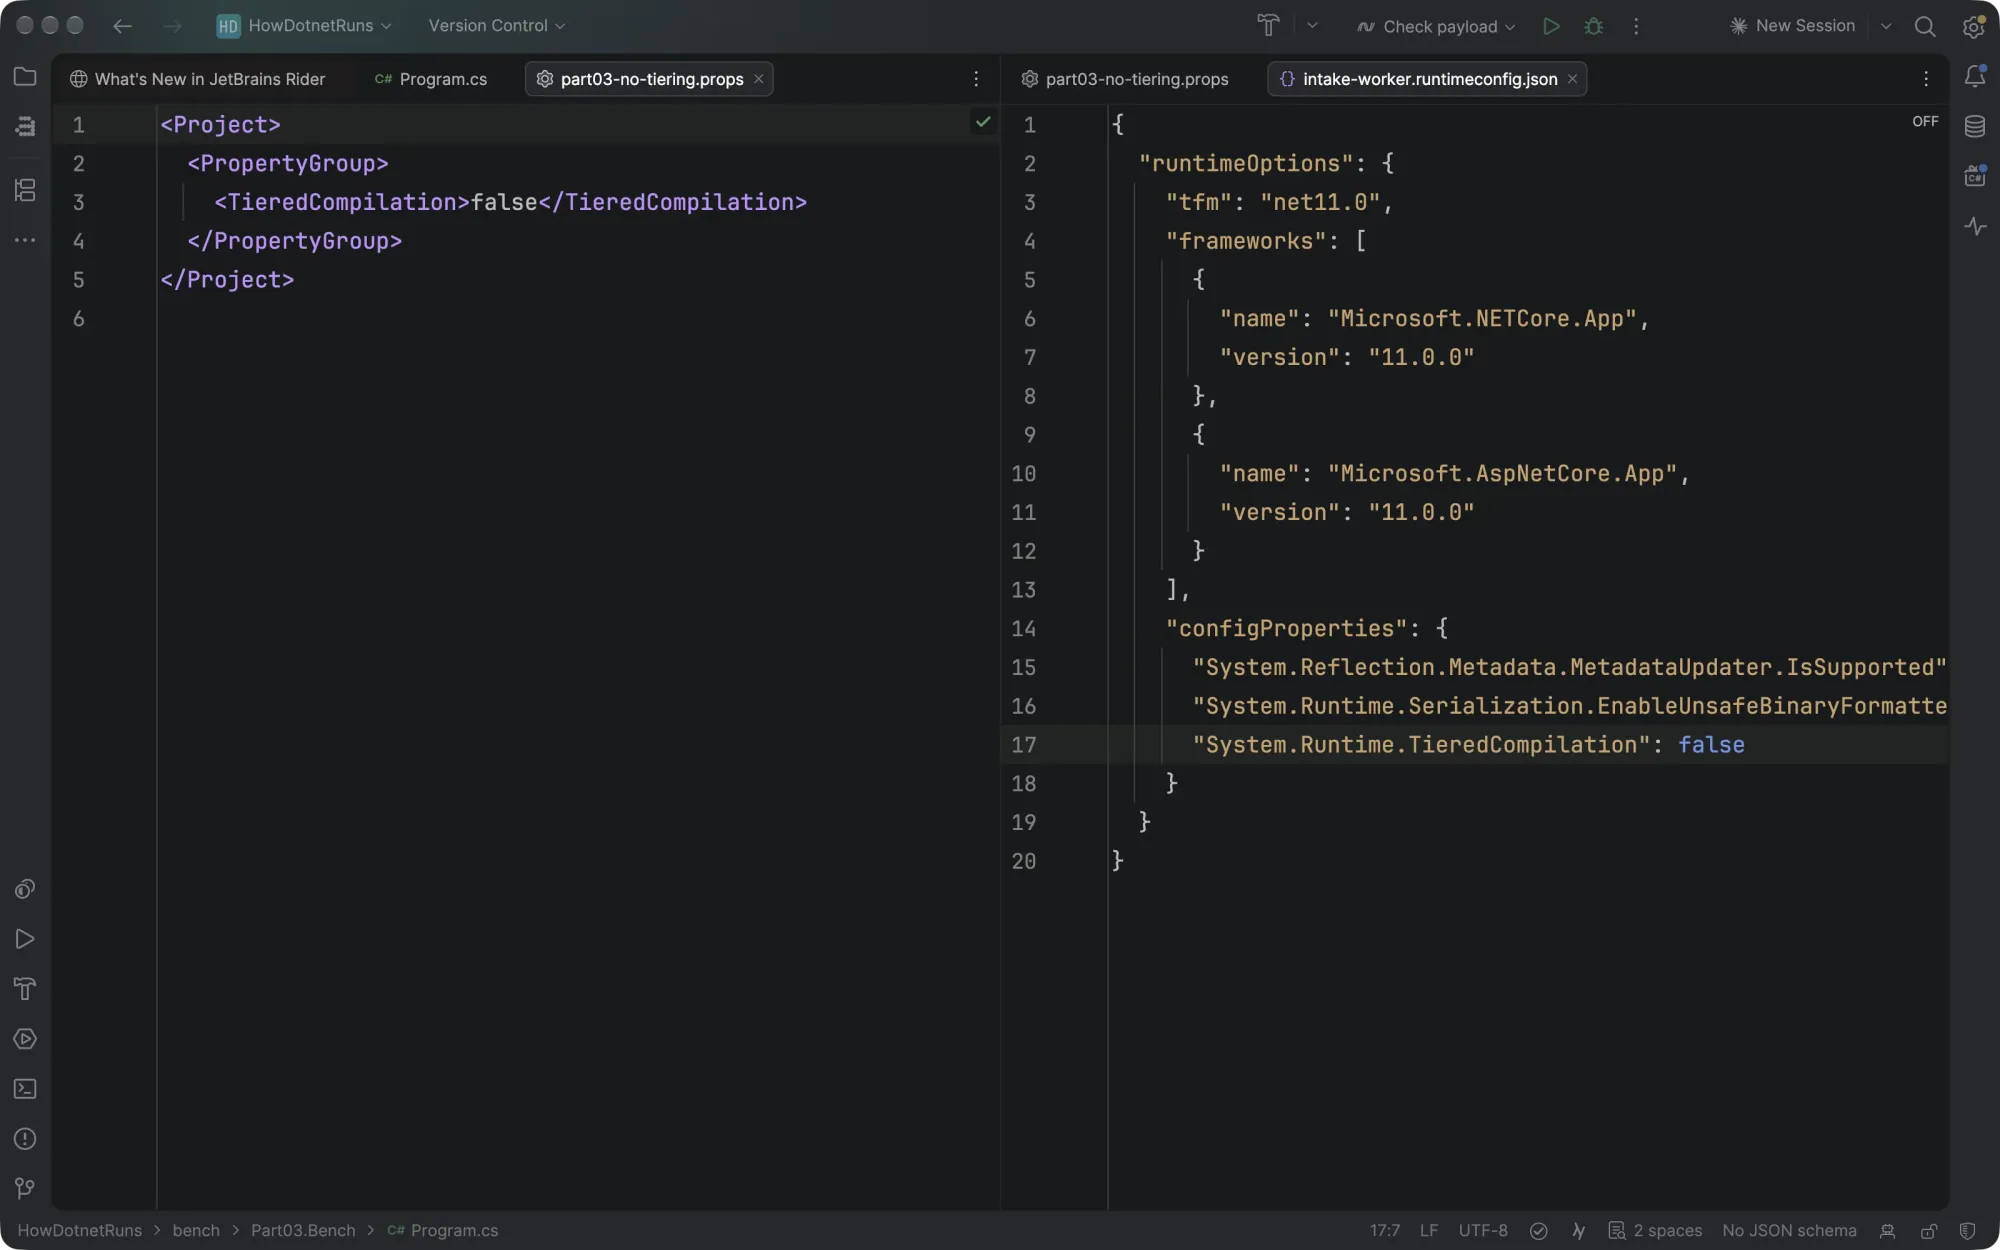
For settings supported by both mechanisms, from .NET 9 onward the environment normally takes precedence. A service launcher can turn this setting back on. Check the environment of the new worker process, including variables injected by a deployment manifest. Inspecting the shell that built its image answers a different question. Runtime configuration precedence.
Use this table when a listing surprises you. Each switch changes one decision. Setting all of them together can erase the very distinction you wanted to observe.
| Decision | MSBuild property | Runtime configuration key | Environment variable |
|---|---|---|---|
| Allow promotion | TieredCompilation | System.Runtime.TieredCompilation | DOTNET_TieredCompilation |
| Quick first-pass JIT | TieredCompilationQuickJit | System.Runtime.TieredCompilation.QuickJit | DOTNET_TC_QuickJit |
| Quick first pass for loops | TieredCompilationQuickJitForLoops | System.Runtime.TieredCompilation.QuickJitForLoops | DOTNET_TC_QuickJitForLoops |
| Collect dynamic profiles | TieredPGO | System.Runtime.TieredPGO | DOTNET_TieredPGO |
| Use available ReadyToRun bodies | PublishReadyToRun creates them at publish | Separate deployment decision | DOTNET_ReadyToRun selects consumption |
Quick JIT disabled still leaves available precompiled code eligible for promotion when tiering stays enabled. Disabling tiering itself changes the first call too: if the runtime needs to compile the method, it now requests full optimization immediately. ReadyToRun (R2R) puts precompiled bodies in managed assemblies. Bodies the process can already use continue running without the usual tiered replacement. With the defaults, a hot R2R method can instead move from precompiled code to an instrumented optimized body, then to code informed by the collected profile. Setting DOTNET_ReadyToRun=0 makes the runtime ignore those precompiled bodies even on the first call. Compilation settings.
For CoreCLR's call-count threshold, the environment value 10 means hexadecimal 10, or sixteen counted entries. A teammate reading the digits as decimal ten can predict a promotion too early. Integer configuration settings have individual parsing rules, so check the specific switch.
Here is a small counterexample you can reproduce. In each child process the driver disables the startup counting delay and turns off dynamic PGO to isolate counting. It calls only the fixed policy, gives queued compilation time to finish, and saves the listing. Start by predicting whether twelve calls will produce an optimized version under both thresholds.
python3 tools/part03.py threshold --out observations/thresholdWith A, the twelve-call process emitted Tier0 and Tier1. With 10, twelve calls emitted only Tier0. Keeping 10 and making twenty-four calls added Tier1. All three processes allowed every input. This is a diagnostic control, with deliberately altered counting behaviour. A decimal number inferred from an ordinary production trace is a much weaker way to diagnose that configuration mistake.
A warm-up average loses the interval Dana is trying to protect
Suppose Lena calls the rule a thousand times and reports a single elapsed time. The stopwatch starts after the rule object has been constructed, so even its first sample excludes the work of building that rule. Inside the interval are first calls, an unknown mix of code versions, loop overhead and any scheduling delay. The one fact the result gives precisely is how long that particular sequence took.
A single number for the first thousand calls
The diagnostic example in FirstCalls.cs runs this timed region. Its accepted total can be right even if the surrounding service misses its startup budget.
var watch = Stopwatch.StartNew();
for (int i = 0; i < 1000; i++)
    accepted += RuleLoop.CountAllowed(rule, sizes);
watch.Stop();
Count only correct completions in each window
The harness starts the clock immediately before launching a published child. An API response must acknowledge the expected job. The worker must reply after running its rule and exporting the job.
submit(count + 1)
index = window_index(start, time.monotonic_ns())
if index < len(windows):
    windows[index] += 1
    count += 1
The index uses 100 ms intervals from launch. A slow start leaves empty windows in the output. An operation that crosses an interval edge belongs to the window containing its correct response. With one client waiting for one reply at a time, the result includes the client and transport as well as the worker. It measures useful work from this client's point of view. It cannot tell you the service's maximum throughput under many concurrent clients.
For a receiver study, publish the application once for the selected runtime. Feed the same jobs to that artifact under each setting and use the CPU quota it will receive in service. The harness launches ten fresh processes per setting in rotating order. Compare the window ending at one second across processes, then the window ending at ten seconds, and keep the late windows too. Per-window medians preserve the shape of a typical start. With ten launches the nearest-rank p95 and p99 each select the maximum, so the tail has coarse resolution. Keep the original arrays if an outlier might change the decision.
Now ask a narrower question about the running loop. The BenchmarkDotNet program uses the same rule and four sizes in both jobs. The disassembly diagnoser lets you inspect what the harness compiled. Here are the job definitions, with common configuration and the runner omitted.
var config = DefaultConfig.Instance
    .AddJob(Job.Default.WithId("Defaults").DontEnforcePowerPlan())
    .AddJob(Job.Default.WithId("PgoOff").WithEnvironmentVariable("DOTNET_TieredPGO", "0")
        .DontEnforcePowerPlan());
Leave warm-up and measurement iterations to the normal BenchmarkDotNet job. The power-plan option prevents it from changing machine settings. The benchmark returns the count, so the result remains observable. Each benchmark operation is one call that processes four sizes. The service experiment asks about arrivals over time. This benchmark asks about the established cost of that particular rule loop. Neither one can substitute for the other. Choosing a measurement that matches the caller.
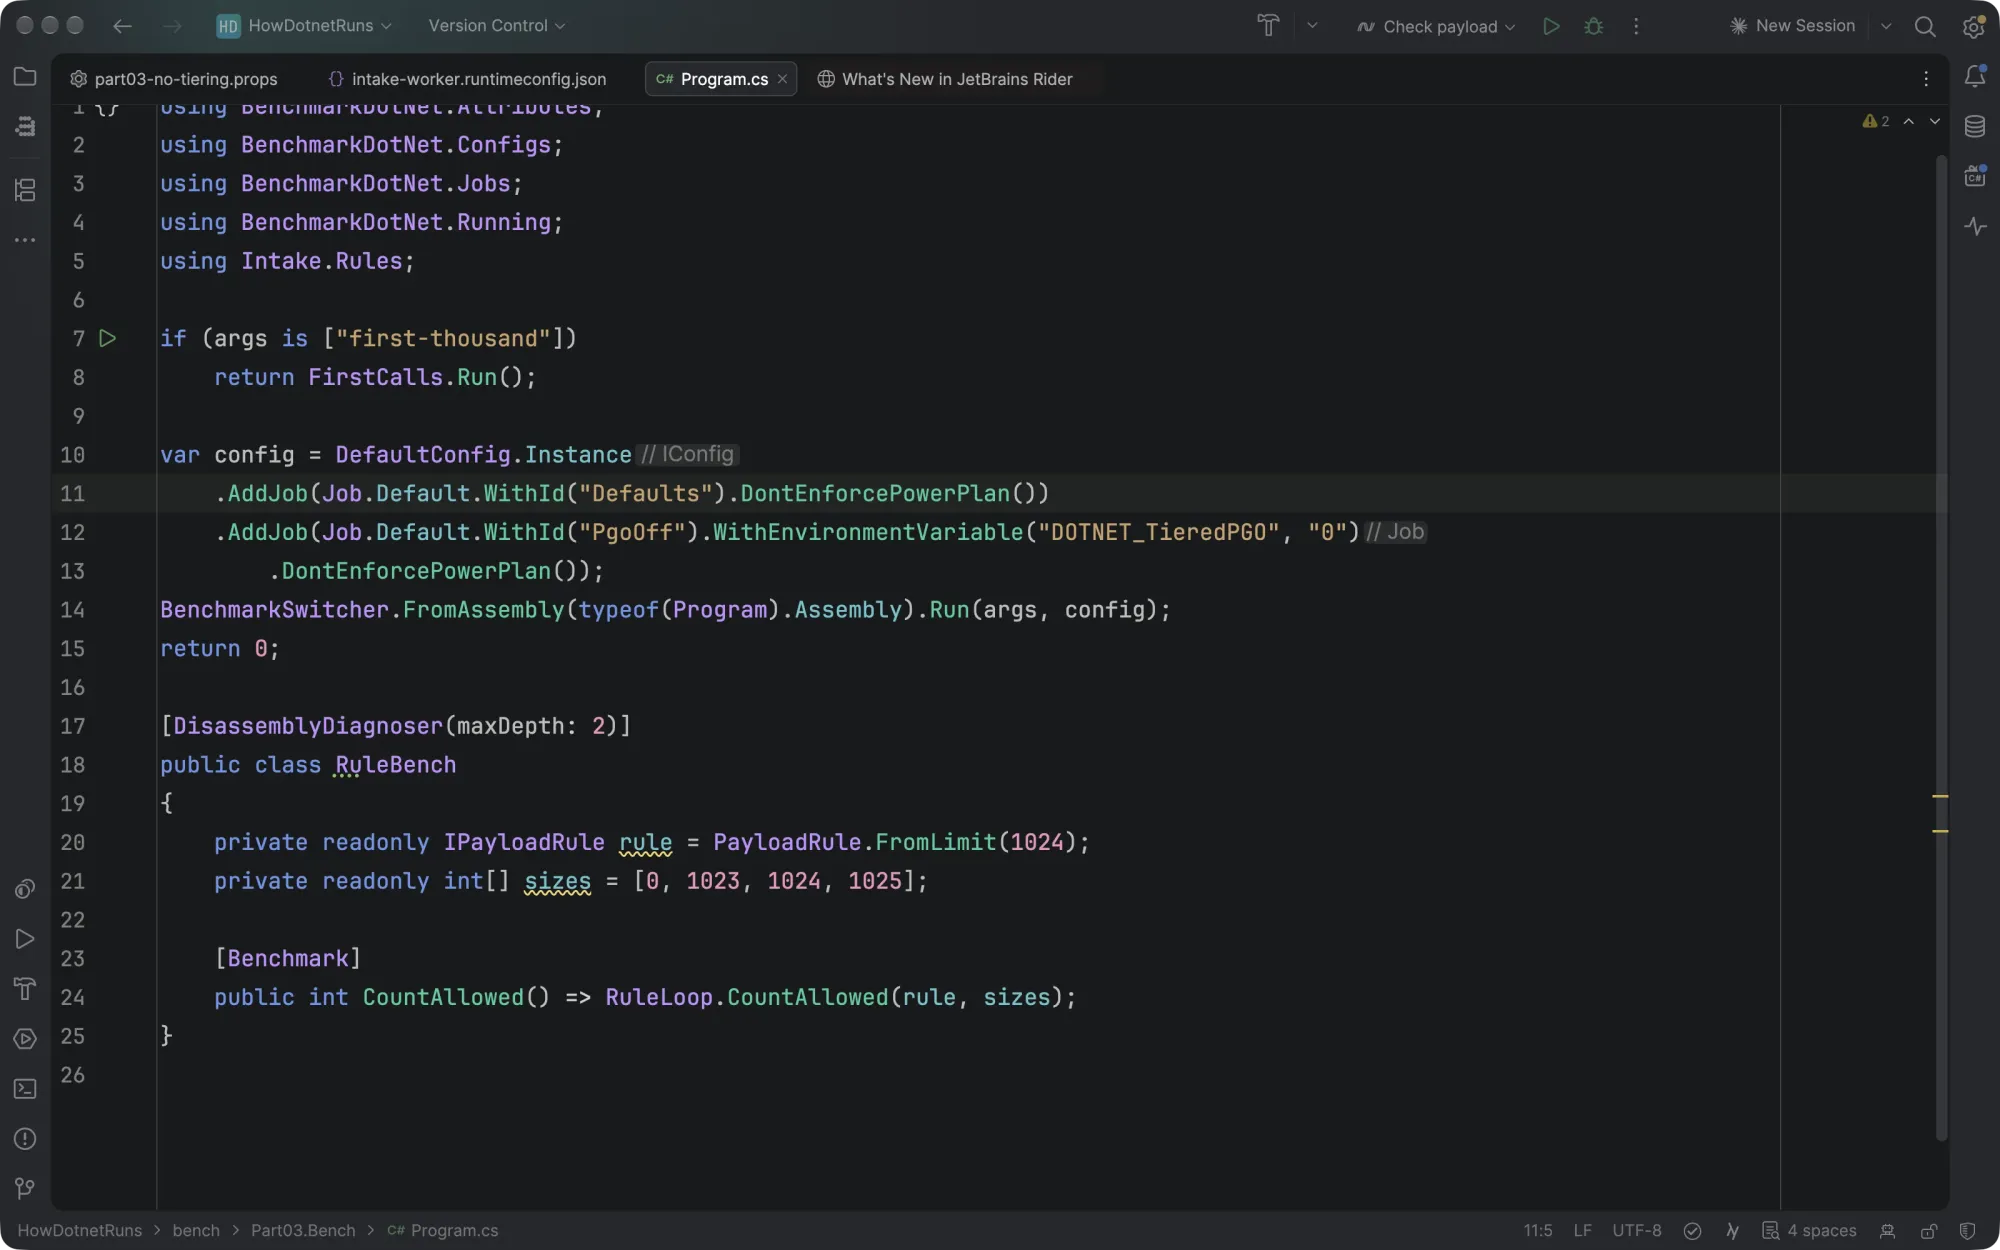
RuleLoop.CountAllowed with the same input. Only the PgoOff job overrides DOTNET_TieredPGO.Will switching tiering off improve the one-minute rate? The Mac and Windows runs collected method listings on shared receivers. To decide whether to change the worker’s tiering setting, Dana still needs its rate of correct jobs during startup and after warm-up with tiering on and off.
A command-line tool can finish with one body for its own policy
The tool runs the same policy in a different lifetime. Launch intake check 1024, observe its answer, then count the JIT-generated body load events from that process. Start recording before managed code begins. Attaching after the shell prints allow would throw away the very work you mean to count.
The tool-tiers command starts EventPipe, the runtime event recorder, with the child and enables the JIT and loader event keywords. The reader selects verbose method loads marked as JIT-generated, accepts only traces with zero reported event loss, and checks that PayloadPolicy.Fits appears. One method can load several bodies. The table counts load events across the process. To inspect a single method, search method-loads-1.json for Intake.Core.PayloadPolicy.Fits and read its tier field.
python3 tools/part03.py tool-tiers --framework net11.0 --out observations/tool| Receiver | Runtime | Fresh processes | QuickJitted loads per process | Optimized loads per process |
|---|---|---|---|---|
| Mac Arm64 | .NET 10 | 5 | 9 | 13 |
| Windows x64 | .NET 10 | 5 | 14 | 13 |
| Mac Arm64 | .NET 11 | 5 | 6 | 12 |
| Windows x64 | .NET 11 | 5 | 6 | 12 |
All five runs agreed within each row. Fits appeared as QuickJitted once in every process. The optimizer label elsewhere in a trace does not mean that this policy reached Tier1. A method can receive optimized code on its first compilation. A service-age graph would answer little about this command. The operator is already back at the shell.
For a long-lived worker the runtime also exposes dotnet.jit.compiled_methods. The download contains a CSV from an actual worker fed twelve named jobs. The collector labels the exported series Rate and gives the unit as methods per sampling interval. Read the unit before interpreting a fall between adjacent rows. It is possible to have fewer compilations in the next interval while the total number compiled since process start keeps growing. That meter identifies neither the method nor its tier. Follow it with method loads when that distinction matters. How the diagnostic changes the run.
One CPU changes both the work and who gets to run it
Ravi's autoscaler can give a new instance one CPU even when the host has many. The runtime’s single-processor configuration lengthens the call-counting delay. Later, when the background compiler can run, it shares the same CPU allowance as the thread draining jobs. A more efficient hot loop could help an established worker even if the queue grows while the instance is getting there. A one-CPU container at startup is a different case from a process allowed to occupy four CPUs on an idle developer machine.
Start by checking the limit that the runtime actually sees. We ran the same .NET 11 policy build in two native Linux Arm64 containers. Environment.ProcessorCount reported one in the first and four in the second. Read the first-call listing beside the visible CPU count in shot 6. Matching the intended quotas lets you compare the right processes when a quiet receiver is available.
Give each receiver its own row. Run the same artifact, job fixtures and completion checks at each CPU quota. Keep the client placement, available memory and cache policy explicit. Putting the client inside the same quota spends some of the worker's budget on generating requests. An earlier or later compiler event can suggest where to look. Only the receiver measurement can say how many correct jobs its customers received in the interval.
--cpus option to Environment.ProcessorCount. Both processes see the assigned quota and emit a Tier0 body on the first call. Full recordingThe code-size rows already illustrate the same discipline across runtime versions. The Arm64 rule loop produced a 232-byte Tier1 body on .NET 10 and a 228-byte body on .NET 11. The x64 sizes went the other way, from 150 to 152 bytes. All four passed the same inputs. Different body sizes tell you which assembly listings deserve a closer look. To find out which runtime finishes this rule loop sooner, time the same inputs on the same receiver.
Run the method study before making an image change
The release build in src/Part03.Tiers references the same policy and rule projects as Intake. The driver pins its children to the .NET 10.0.15 and 11.0.0 runtimes with --fx-version. Install both before running the two commands below from the download root. Each command writes into the directory you choose. Use a fresh directory to keep the original results for comparison.
python3 tools/part03.py listings --framework net11.0 --out observations/net11
python3 tools/part03.py listings --framework net10.0 --out observations/net10
Begin with the once-only files, then search each paced-1.asm for Fits, CountAllowed and Drain. Keep the process output beside the listing to verify its answer. Video lesson 01 shows how to find one method body with tiering disabled. The extra experiment here is to keep that method under observation across three compilations, follow a running loop into OSR and compare two receivers.
- Record the runtime, receiver architecture, effective process settings and published artifact for the failing case.
- Compare a first-call body with one from the actual repeated workload. Save the method name, tier and original listing.
- Keep separate acceptance criteria for the first correct response and sustained work. Exercise the real API or worker under the production CPU quota.
- Change one switch at a time. Revert it when a repeatable benefit disappears or another release budget is breached.
Further reading
Dana keeps the runtime defaults for the API and worker. A first-call listing justifies a diagnostic override. A PGO change needs a verified gain in the affected budget on the actual receiver and acceptable first-job and sustained results. The effect of that PGO switch on Intake’s job rate remains open. Part 9 changes the runtime version and asks whether the ASP.NET API meets its request deadline.
There is one more puzzle. On the Mac, the small method-only fixture reported two JIT compilations on an ordinary run. Published with ReadyToRun, it reported zero. Launch the same artifact again with DOTNET_ReadyToRun=0, and its summary contains 640 numbered JIT compilation entries for the very same answer. Where did those method bodies come from when the JIT had nothing to report?
Series How .NET Runs Your Code, part 3 of 11. Previous: Part 2, when a method becomes machine code. Next: Part 4, ReadyToRun and the code the JIT can replace.