

Series · How .NET Runs Your Code, part 2 of 11. Previous · What a .NET release ships. Next · Why .NET compiles the same method twice.
Dana’s release memo now identifies the API image down to its files and layers. The next instance starts from that image, reports ready and receives a 1,024-byte job. Suppose the client retries before it sees an answer. Ravi suspects that the instance spent the wait compiling its payload check. Can the team tell whether those instructions existed when the health probe returned?
Dana selects one rule, PayloadPolicy.Fits, and keeps two inputs beside it. Exactly 1,024 must pass and 1,025 must fail. A small executable calls the same rule, so Dana can follow those outcomes from the C# expression into the file and the running process. Explaining the customer’s wait will require a separate observation of the HTTP request.
- The ordinary build ships the check as portable instructions. Its just-in-time compiler (JIT) can translate the check when somebody calls it. The health endpoint never makes that call.
- On Apple Silicon the first call changed where the caller’s existing address led. The second call reached the compiled comparison through that same address.
- The native publish already contained instructions for the check. The optimized JIT produced the same comparison on the Mac. Its first version under default settings looked different.
- The Xeon can compare sixteen temperatures at once. Its 512-bit path lost to 256 bits in every block at 37 readings and won in every block at 4,096.
The compiler leaves a portable rule in the assembly
In Intake, POST /jobs reads the payload size, rejects a negative value, then calls Intake.Core.PayloadPolicy.Fits. The operator's intake check command calls the same method. It takes the limit as an argument. A value exactly equal to the limit belongs on the accepted side.
The method probe substitutes a small console program for the service. One command returns after printing Ready. Another passes a size and the limit to the shared class. That gives Dana two paths through the same published files, without going through the HTTP pipeline, JSON reader or application job queue. Look for the attribute directly above the comparison. It asks the compiler to leave this method available as a separate call. We will remove it once we know what to look for.
#if !ALLOW_POLICY_INLINING
    [MethodImpl(MethodImplOptions.NoInlining)]
#endif
    public static bool Fits(int bytes, int limit) => bytes <= limit;
Build the ordinary Release version and open Intake.Core.dll. The C# compiler translated that expression into a portable set of instructions called intermediate language (IL). Its operands live on a conceptual evaluation stack. An IL viewer shows the operations against that stack. Look closely at the inclusive limit. Can you find an instruction that says “less than or equal”?
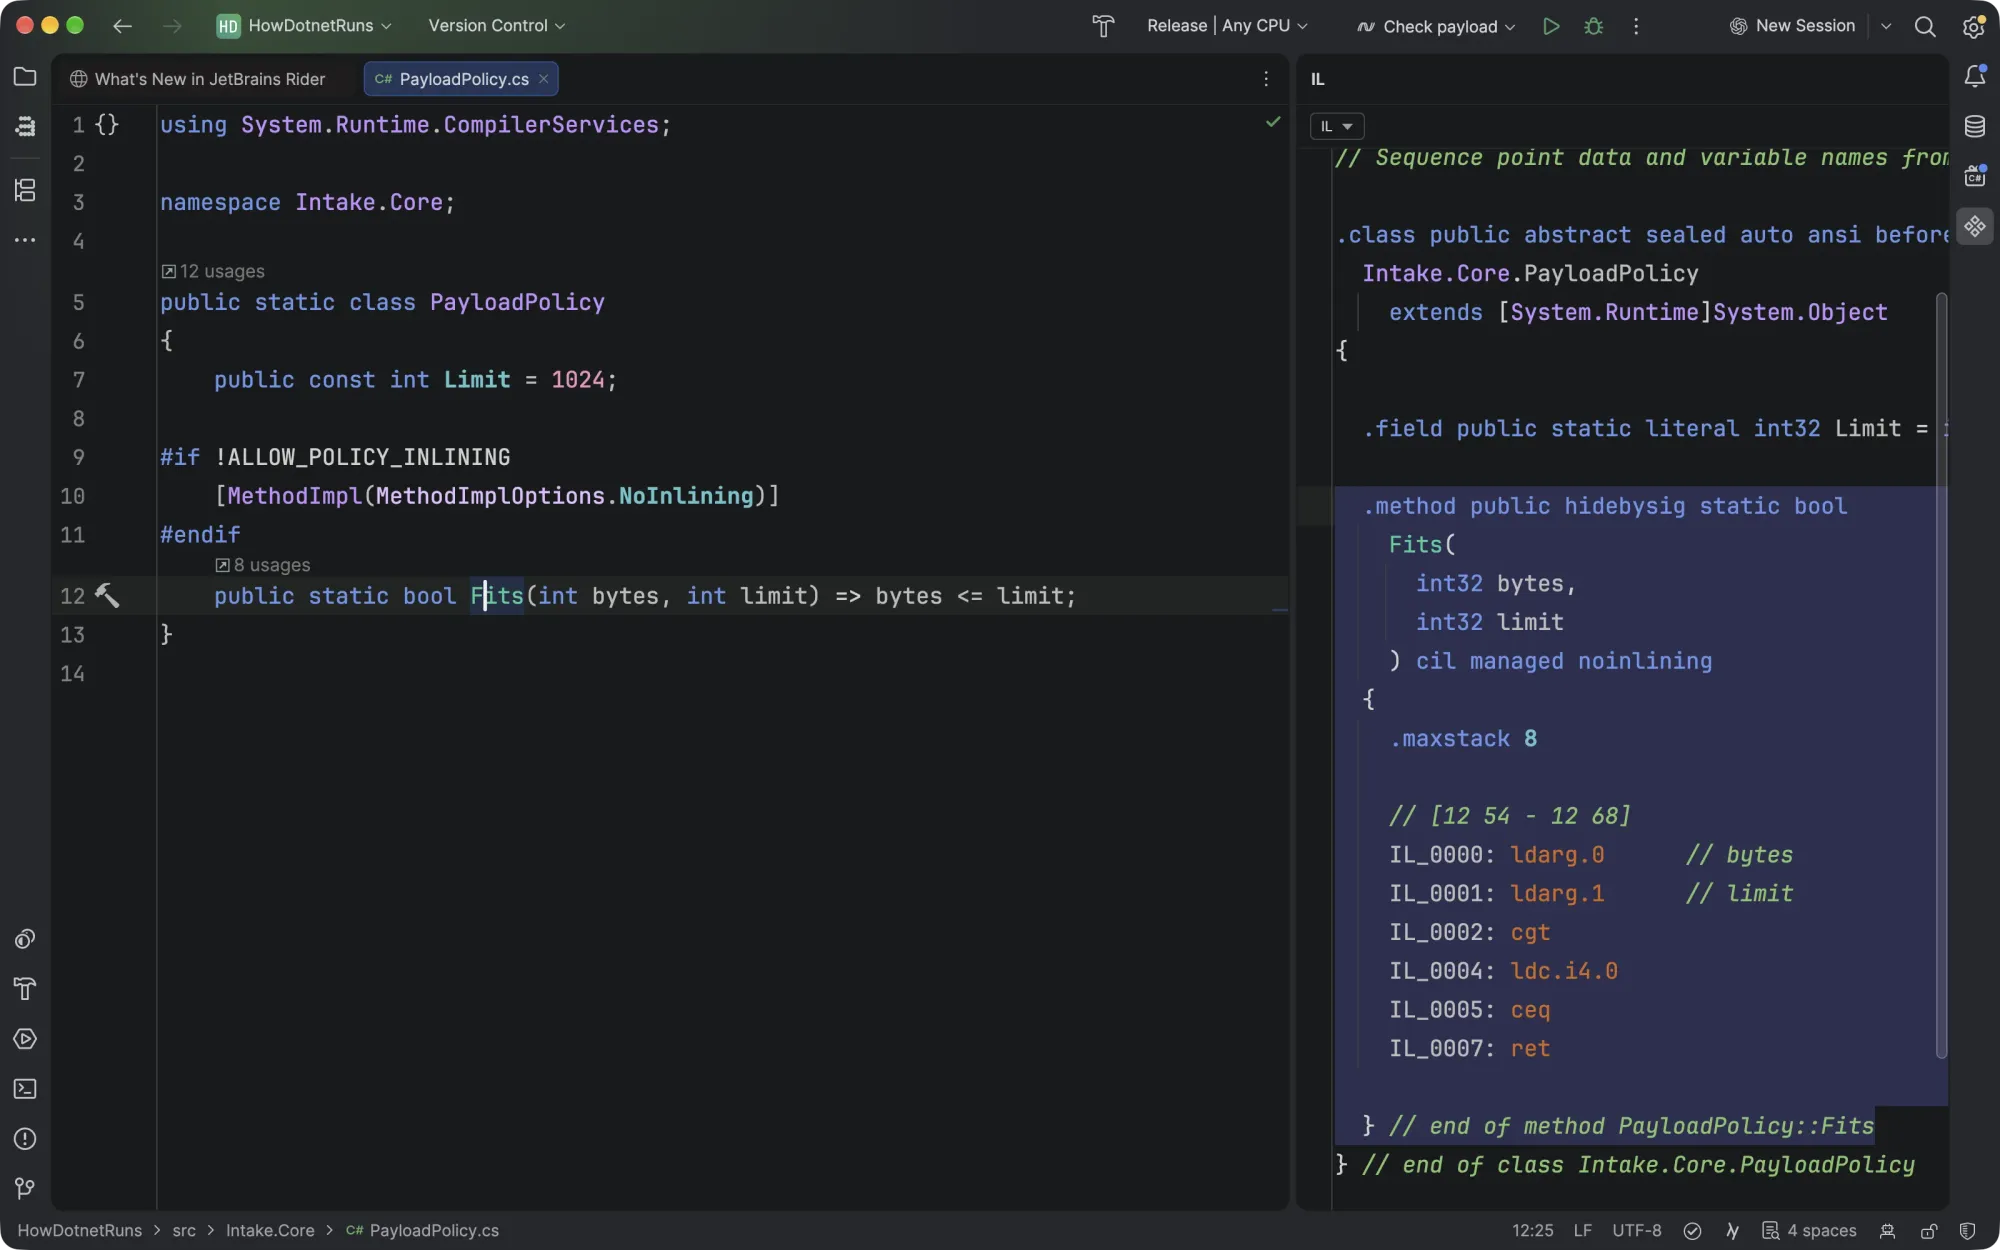
cgt and ceq together. The compiler asks whether the payload exceeds the limit, then inverts the answer.Follow the two arguments. ldarg.0 and ldarg.1 load the size and limit. cgt asks whether the size is greater. The next two operations compare that answer with zero. At equality the first comparison is false, so the second succeeds. The final ret returns true. Six IL instructions occupy eight bytes because two of their encodings consume two bytes each. The IL listing distinguishes a signed comparison from an unsigned one, a detail that would matter if a caller passed a negative size without validation.
If you open the ordinary launcher instead, you will find a native executable for the target processor. That distinction caused trouble in part 1. A launcher can contain perfectly good machine code for starting the runtime while your method still lives in a separate assembly. Here is the output of file for the two Mac files that look most alike in a directory listing. The paths are shortened.
jit/method-probe: Mach-O 64-bit executable arm64
aot/method-probe: Mach-O 64-bit executable arm64
Both answers describe how macOS can load the file. Neither identifies the code for Fits. The ordinary DLL opens in an IL viewer, while LLDB's native symbol search finds no PayloadPolicy__Fits in that DLL or its launcher. A missing debug symbol alone would prove little. Together with the IL and a successful search on the native build, these observations tell Dana which file to take to which tool. How does the ordinary caller call a body that it cannot find in the file?
The runtime gives the caller an address before the body exists
Imagine compiling the caller first. Somewhere in its output it must specify where execution goes next. CoreCLR, the runtime in the ordinary build, can supply a short piece of executable code at a callable address. This entry stub initially takes the caller into the runtime's method preparation logic. When the method needs machine code, the runtime asks the just-in-time compiler (JIT) to translate its IL. It then arranges for subsequent calls to reach that body. CoreCLR supports several entry arrangements, including callers that can reach native code directly. CoreCLR's method descriptor design.
A stable callable address is useful because a caller can keep it across calls. The destination reached through that address can change. To distinguish these two addresses, the probe takes a managed function pointer to the exact method. It calls through that pointer twice, first at the permitted size and then one byte over. Before either call and after each return, a small native function gives LLDB a place to stop. The function receives the pointer and the count of completed calls. It does no work on either value.
For this experiment the runtime compiles one optimized version of the method. We disable tiering, its ability to produce further versions as a method is used. Which address will change after the first call? Will the caller have to obtain a fresh pointer before its second submission?
The second call reuses the entry and reaches the compiled body
- The caller has a stable address for the payload rule and an input equal to the limit.
- The initial target takes control into CoreCLR, where method preparation can request machine code for the shared method.
- The compiler returns a body. CoreCLR changes the destination reached by the existing entry so its callers can use it.
- The first call completes the inclusive comparison. A fresh debugger stop can now inspect the destination behind the same address.
- One byte over the limit changes the answer. The target still points at the body found after the first call.
The Mac Arm64 pointer observations are in entry.txt under results/mac/part02. Tiering and ReadyToRun were disabled for this experiment.
The figure follows the pointer experiment specifically. An optimized caller that has copied the comparison into its own body will have no such call left. Before looking at that counterexample, we need a way to tell whether the JIT compiled the separate method at all.
An idle run and a called run make the diagnostic trustworthy
The JIT can print the processor instructions it emits for a named method. Set DOTNET_JitDisasm to the class and method, then start the already published ordinary executable in a fresh process. The experiment also switches off tiered compilation, which can produce successive versions, and ReadyToRun, which lets the runtime use precompiled bodies. These settings select a particular experiment. They belong on the child process so the next build and the rest of the machine keep their usual settings.
In the extracted solution, build the two executables first. The next two commands start the ordinary published file with DOTNET_JitDisasm=Intake.Core.PayloadPolicy:Fits, DOTNET_TieredCompilation=0 and DOTNET_ReadyToRun=0. Predict the listing count when the child receives --idle, then when it receives 1024.
python3 tools/part02.py build
python3 tools/part02.py idle
python3 tools/part02.py call
The idle path can reach its own output and exit without crossing the call to the payload rule. The called path crosses it, so the same printer that was quiet now emits the optimized body's listing. Look for the method name and the header FullOpts, which identifies a fully optimized compilation in this run.
A count of zero is cheap to obtain. Misspell the namespace in the filter and the named method disappears even when it runs. Leave inlining enabled and its comparison might execute inside the caller. Run the native file and there is no JIT to honor the request. Keep the ordinary executable, filter and switches fixed, change only the path taken, and the called run becomes a positive control for interpreting silence from the idle one. Read the two outputs alongside the counts in the Mac’s idle.txt and call.txt.
| Path through the ordinary build | Application output | Matching JIT listings |
|---|---|---|
Return before Fits | Ready | 0 |
Call Fits(1024, 1024) | allow | 1 · FullOpts |
Try the inverse test. Supply the same JIT filter when starting the native executable. It accepts the limit, rejects the next byte and emits no diagnostic for either call. The absence agrees with the deployment model. To demonstrate that the body is in the file, Dana still needs an observation that actually reads that file.
The native publish has a body you can open before launch
Native ahead-of-time compilation (Native AOT) translates reachable code for a particular target during publish. Its executable can take this method's address before any user input is known. Keep the debug symbols beside that file. They associate names with locations, letting the debugger locate a method by name in an image that would otherwise offer mostly addresses. Microsoft's Native AOT deployment guide.
On the Mac, LLDB reads the native image and its symbols without launching the program. In the clip, find the two argument registers in the comparison. The condition on the next instruction decides whether a payload exactly at the limit is accepted.
Would an ordinary process generate different arithmetic? Read the four representations below in order. In the instruction listings, w0 and w1 hold the signed 32-bit arguments on Arm64. The comparison sets processor flags, which record the result of subtracting for comparison purposes. cset materializes the condition “less than or equal” as a value in the result register. It can return a Boolean without branching down two different code paths.
Eight bytes of IL become a comparison in the target processor's registers
// C# · Intake.Core
[MethodImpl(MethodImplOptions.NoInlining)]
public static bool Fits(int bytes, int limit) => bytes <= limit;

// ILSpy · ordinary Release assembly · 8 bytes
IL_0000: ldarg.0
IL_0001: ldarg.1
IL_0002: cgt
IL_0004: ldc.i4.0
IL_0005: ceq
IL_0007: ret

// macOS Arm64 · FullOpts · JIT
cmp     w0, w1
cset    x0, le

// macOS Arm64 · native file · LLDB
cmp    w0, w1
cset   x0, le

// macOS Arm64 · ordinary process with default settings
; Assembly listing for method Intake.Core.PayloadPolicy:Fits(int,int):bool (Tier0)
; Total bytes of code 40- A call passes both the size and the limit. The attribute preserves a separate target for the experiment.
- Load the arguments, test greater than, then compare that answer with zero. Equality therefore returns true.
- After an ordinary process calls the rule, the optimized Arm64 body uses condition flags to produce the answer.
- The native executable contains the same two comparison instructions even though the debugger has never launched it.
- Restore the ordinary runtime's defaults and the header changes. The size now describes a different version of the same method.
Filtered Apple silicon method listings under results/mac/part02. The full Arm64 listings include the stack frame and return.
Here the optimized Arm64 JIT version and the native file each contain six instructions, occupying 24 bytes. Restore default settings and the first JIT version has a Tier0 header. On this Mac it stores both incoming arguments to the stack and reloads them before comparing. That adds four instructions and brings the body to 40 bytes. The same input still produces the same answer. Which version would a customer encounter on the ordinary deployment? For a separate, newly compiled call on this build, the default run is the relevant one. The forced optimized body helped us isolate a mechanism.
The .NET 10.0.15 Mac replay gives the same distinction. That supports a statement about this method and these two runtime releases. It does not extend the observation to every target processor, every method or the rest of the API. In particular, what happens when we remove the one line that deliberately kept the comparison separate?
The caller can contain the comparison even when its name disappears
Ravi finds a release that accepts the 1,024-byte job but prints no listing for Fits. He already knows that an idle process can be silent. This time the checked input actually took the decision path. The build allowed inlining, so the optimizer could copy the comparison into Program.Main. Removing NoInlining permits that transformation. It gives no guarantee that the optimizer will choose it at every call site. MethodImplOptions and NoInlining.
Where should Dana look next? Start with the callee, the method being called. The first two cases keep the input, Mac target, JIT filter and optimized settings fixed. Only the build that permits inlining can fold the direct call into its caller. Then change the filter to the caller and, finally, change the question from what the caller executed to what the native file contains.
The caller can contain the rule even when a separate copy survives in the file
- With inlining prohibited, the optimized JIT prints a separate comparison of the two incoming argument registers. The named filter works.
- Permit inlining and keep the input at the limit. The process still prints
allow, while the filter for the callee prints no listing. - In the caller the limit is now an immediate operand, and a conditional select chooses the message. The direct path can decide locally.
- The native caller also contains the constant comparison. A different path takes a function pointer to
Fits, and the same native file still contains its callable body.
Apple silicon. Compare call.txt with the four inline-*.txt listings in results/mac/part02. Only the decisive instructions are shown.
Read the two lines in the optimized caller together. cmp w0, #0x400 compares the input with the immediate constant 1,024. csel x0, x1, x2, le chooses the prepared message in x1 when the signed comparison is less than or equal, or the message in x2 otherwise. Main already knows that its limit argument is constant and that its next consumer needs a message. At this call site the compiler can drop the separate Boolean return and select the message directly. In the addressable native body the argument is still in w1, because a different caller may pass a different limit.
Try it on a missing frame. Suppose a batch importer accepts a record at its limit and rejects the next one, but its leaf validation method is absent from an optimized profile. Write down those two inputs and the immediate caller. First establish that your filter finds the leaf in a separately compiled control. Next inspect the shipped caller for the constant, comparison and use of the result. Finally inspect an input path that bypasses validation and look for where the two paths diverge. If the shipped caller contains the rule, that direct use needs no separate validation frame. A sampler can also miss a brief call. The caller’s instructions and the two expected outcomes make a stronger case than an absent frame alone.
Find the two arguments before you read the comparison
Start with static bool Fits(int bytes, int limit). Both arguments are signed 32-bit integers. The platform’s calling convention, part of its application binary interface (ABI), tells the caller where to put them. The instruction set architecture (ISA) gives the JIT the operations it can use to turn their comparison into a Boolean.
In each cmp below, the first operand holds bytes and the second holds limit. The three ordinary Release builds ran Fits(1024, 1024) on .NET 11.0.0 with tiering and ReadyToRun disabled. Each header says FullOpts. The hosts were an Apple M3 Max and an AMD EPYC 7502P. Azure Linux 3.0 ran as an emulated x64 guest on the Mac. Where would you look for limit when switching from Windows x64 to Linux x64?
- macOS Arm64
cmp w0, w1followed bycset x0, le.- Windows x64
cmp ecx, edxfollowed bysetle alandmovzx rax, al.- Linux x64 guest
cmp edi, esifollowed bysetle alandmovzx rax, al.
To inspect limit, read edx on Windows and esi on Linux. Both targets use setle to write one or zero into al, the low byte of the return register. movzx fills the remaining bits of rax with zeros. On Arm64, w0 and w1 hold the inputs and cset writes the answer into x0. At equality each sequence returns one. At 1,025 against 1,024 it returns zero. Arm register roles · Windows x64 argument passing · System V AMD64 parameter passing.
In the Windows debugger, follow the incoming registers to their saved stack slots. This body spills both arguments before comparing them.
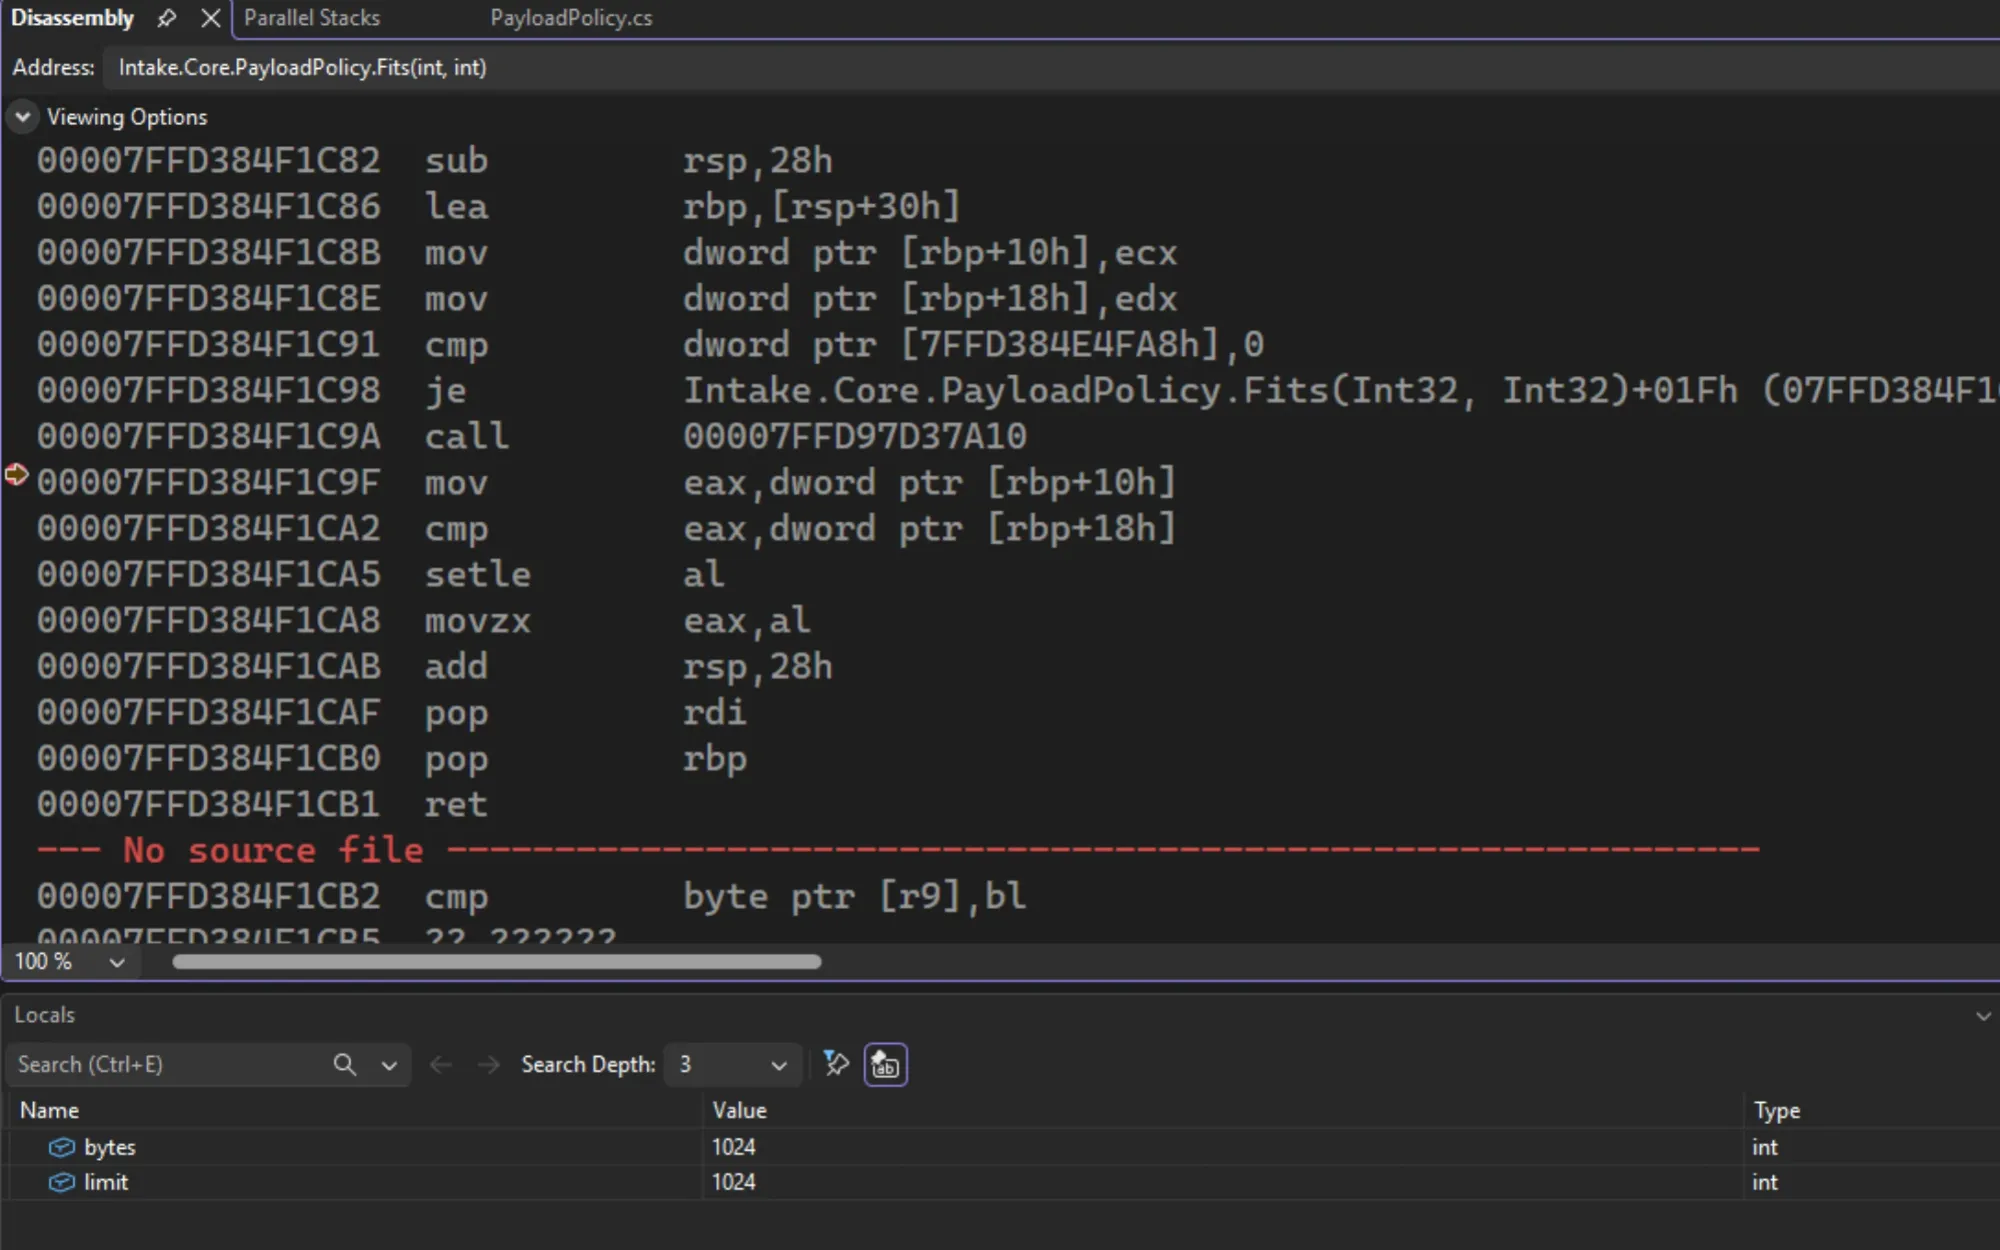
cmp, then read setle.The native Linux Arm64 control on the same Mac produced the macOS instruction pair. Both Linux Fits listings are in results/linux/part02. To compare physical x64 CPUs, switch to the separate bit-count and vector probes below.
The same portable DLL can select different instructions
First keep the method fixed. On the EPYC’s Linux x64 guest under WSL2 and on the Xeon’s native Ubuntu host, the .NET 11 JIT translated CountSetBits(240) to a body containing popcnt eax, edi. The Windows run on the same EPYC used popcnt eax, ecx. On the M3 Max the JIT emitted cnt followed by addv to add the per-byte counts. Every run returned four. Both x64 processors support population count, one of the instructions in the .NET 11 x64 baseline. .NET 11 hardware requirements.
Now keep the assembly fixed and let its C# code choose a method. VectorSum.Evaluate sums 37 signed integers, 1, -2, 3, -4, …, 37. It explicitly selects an AVX-512F kernel if available, then tries accelerated 256-bit or 128-bit vectors, with a scalar fallback. SIMD stands for single instruction, multiple data. Here each vector lane holds one 32-bit integer. How many lanes does the selected instruction add at once?
| Processor and environment | Selected kernel and inner-loop instruction | Checked sum |
|---|---|---|
| Apple M3 Max · macOS and Linux Arm64 guest | Vector128Kernel · add v16.4s, v16.4s, v17.4s | 19 |
| AMD EPYC 7502P · Windows x64 and Linux x64 under WSL2 | Vector256Kernel · vpaddd into ymm0 | 19 |
| Intel Xeon W-2295 · Ubuntu Linux x64 on hardware | Avx512Kernel · vpaddd into zmm0 | 19 |
The PlatformComparison.dll and input hashes match across all five reports in results/platforms-native/. All used .NET 11.0.0 with tiering and ReadyToRun disabled. Pick a processor. Each short notch marks one integer, and the tall dividers separate full vectors. How many values remain for the scalar loop?
Three vector widths sum the same 37 integers
- The portable 128-bit path adds four integers at a time. Nine complete groups cover 36 values, leaving the final +37 for the scalar loop.
- With AVX-512F unavailable, the 256-bit test succeeds. Four groups cover the first 32 values. The five remaining values add up to 35.
- On the Xeon the runtime prefers narrower general vectors, but permits explicit AVX-512F. That first check selects two groups of sixteen and a five-value tail.
Flags, lane counts, tails and results from results/platforms-native/. The strip and partial sums are derived from the 37 signed inputs. All five invocations agree with the independent scalar sum.
The AMD and Intel Linux listings even use the same memory operand, [rdi+4*rdx]. Both use vpaddd. The YMM and ZMM destination registers reveal a 256-bit and a 512-bit addition, respectively. On the Xeon, the program tested Avx512F.IsSupported first. That true result selected the kernel that explicitly calls Avx512F.Add. The general Vector512.IsHardwareAccelerated flag was false. Microsoft documents a narrower default on some AVX-512 processors because wide instructions can reduce clock frequency. This run observed the selected kernel and its instructions, with no frequency measurement. .NET hardware intrinsics and the Vector512 policy.
When does a wider vector help count hot readings?
Suppose Intake receives motor temperatures. The operator wants the number of readings above 85 °C in each incoming batch. The same rule can rescan a day of readings after an alarm threshold changes. Both jobs have the temperatures in memory, but the first may have only a few dozen values. Would you ship the same loop for both?
Store hundredths of a degree in a signed integer so the boundary is exact. The scalar loop increments its count once per hot reading. A reading of 85.00 °C contributes zero and 85.01 °C contributes one.
public static int Scalar(ReadOnlySpan<int> values, int threshold)
{
    int count = 0;
    foreach (int value in values)
        count += value > threshold ? 1 : 0;
    return count;
}
Now compare four readings at once. Imagine the lanes hold [8400, 8500, 8510, 9300]. The result of comparing them with 8500 is a mask, one answer per lane. A true comparison sets every bit in that lane. For a signed integer that means -1, so this mask is [0, 0, -1, -1]. Subtract it from four counters and the last two each gain one. How .NET represents vector comparison results.
Here is the inner loop and return from Counter.Simd128. The full method initializes four counters to zero, copies the threshold into every lane of limit, and takes a reference to the first reading. The loop condition makes sure an entire group fits before loading it.
for (; i <= values.Length - Vector128<int>.Count; i += Vector128<int>.Count)
{
    var readings = Vector128.LoadUnsafe(ref first, (nuint)i);
    // A true comparison is all bits set, or -1 as a signed Int32.
    counts -= Vector128.GreaterThan(readings, limit);
}
return Vector128.Sum(counts) + Scalar(values[i..], threshold);
The return adds the lane counters, then checks any leftover readings with the scalar rule. The 256-bit and explicit AVX-512F versions handle eight and sixteen readings per full group. For 15 readings the 512-bit loop cannot run even once. At 16 it handles the entire batch in one group, but still has to combine its lane counters. For a long array, all three paths must also read four bytes per reading. Lane count alone gives you no elapsed time for any of those jobs.
The benchmark uses repeatable, generated temperatures. Its first 37 contain 22 readings above the threshold. Every timed batch must agree with the independent count from readings.Count(value => value > 8500). On each machine the same .NET 11 DLL ran in eight fresh processes with tiered compilation disabled. Each process supplied one block of results. It warmed up the methods, timed the supported paths on nine buffer sizes and checked the answers outside the timer. The order alternated between blocks.
Start with one physical machine, the Xeon W-2295 running Ubuntu. For each buffer size, divide the time of a narrower scan by the time of the 512-bit scan in the same process. A ratio of 1 means equal times. A ratio of 1.5 means the wider implementation processed the same data at 1.5 times the rate. Where does it beat both narrower paths?

results/temperature/paired-ratios.csv.At 37 readings the plain C# loop took 19.72 ns per scan at the median. Switching to 256 bits saved about 12 ns, bringing that down to 7.60 ns. Switching again to 512 took 9.09 ns. Even at 64 readings the 512-bit path beat 128 bits and still lost to 256. The Xeon JIT inlined the two narrower loops into their timed wrappers, while the 512-bit wrapper retained a call. Those times include the calls, the vector work and the scalar tail.
At 256 and 4,096 readings, 512 bits clearly beat both alternatives. At 4,096 readings, a 16 KiB buffer, the paired median speed ratios were 1.50 against 256 bits and 2.68 against 128. Increasing the buffer again did not preserve the lead over 256. At 4 MiB the ratio was 1.015 with five wins out of eight. At 128 MiB it was 1.026 with seven wins. The largest buffer got one timed scan per method per process, after the program had filled and checked the array. We collected no cache-miss, memory-bandwidth or clock-frequency counters to explain the smaller gap.
For a 128 MiB rescan, which machine finished first? At each machine's widest supported width, the median was 5.07 ms on the M3 Max (128 bits, macOS), 8.58 ms on the EPYC 7502P (256 bits, Windows) and 11.93 ms on the Xeon (512 bits, Ubuntu). The team then repeated the M3 test in three independent sessions, using the identical DLL and inputs. At 128 MiB its median was 4.87 ms with SIMD128 and 10.22 ms with the scalar loop. SIMD128 finished sooner in all 24 pairs. At 15 readings the scalar loop won 23 of the 24. All three machines were shared. Part 9 compares the machines at both their widest path and a common 128 bits.
Does the Xeon’s 512-bit counter still beat the scalar loop when those 37 readings arrive as a file? Opening the CSV, reading it, parsing its decimal values and returning the count took 5.06 µs with the scalar counter and 5.19 µs with the 512-bit counter at the median. Both found 22 hot readings. The 512-bit version finished sooner in three of eight paired trials. For an importer, time the operation the caller waits for before choosing a counting loop. Compare the small file and a full day of readings on all three machines.
To repeat the timings, open bench/temperature/TelemetrySimd in the download. Use the native .NET 11.0.0 runtime for your CPU. These commands unpack the measured DLL, check the answers and run all eight blocks. On Windows use py -3 for python3.
python3 -m zipfile -e ../temperature-sampler.zip kit
python3 repeat.py kit/TemperatureSampler.dll my-temperature-run
Open Counter.cs beside my-temperature-run/assembly.txt to see how your JIT compiled the loops. Each block-*.csv gives the time per scan for scalar and the widths your CPU supports. The README also includes a longer BenchmarkDotNet experiment with normal tiering. Compare a different buffer size in results/temperature/report.html. To rebuild the Xeon chart from the original timings, run python3 results/temperature/render.py from the root of the download.
Return to Dana’s first job. The temperature scan times code that is already running. Which event tells her when the ordinary process began compiling Fits?
A compilation event puts the method on a timeline
A static file has no first-request timestamp. A listing shows what the compiler produced and can arrive on a different output stream from the application. Even their display order can change with buffering. To put an event on a timeline, collect it from the runtime itself. The trace command launches the published ordinary file under dotnet-trace, enabling the runtime provider's JIT keyword, then filters the recorded events for the class and method. Starting the collector before the child matters for a short-lived command.
Look for Method/JittingStarted. Each of five new processes on the Mac and five on Windows emitted one such event for Intake.Core.PayloadPolicy.Fits. The timestamp is relative to that trace's start. The collector observed the runtime beginning to compile the method. It did not time the compiler's work, still less a customer's HTTP request. Runtime method events and keywords.
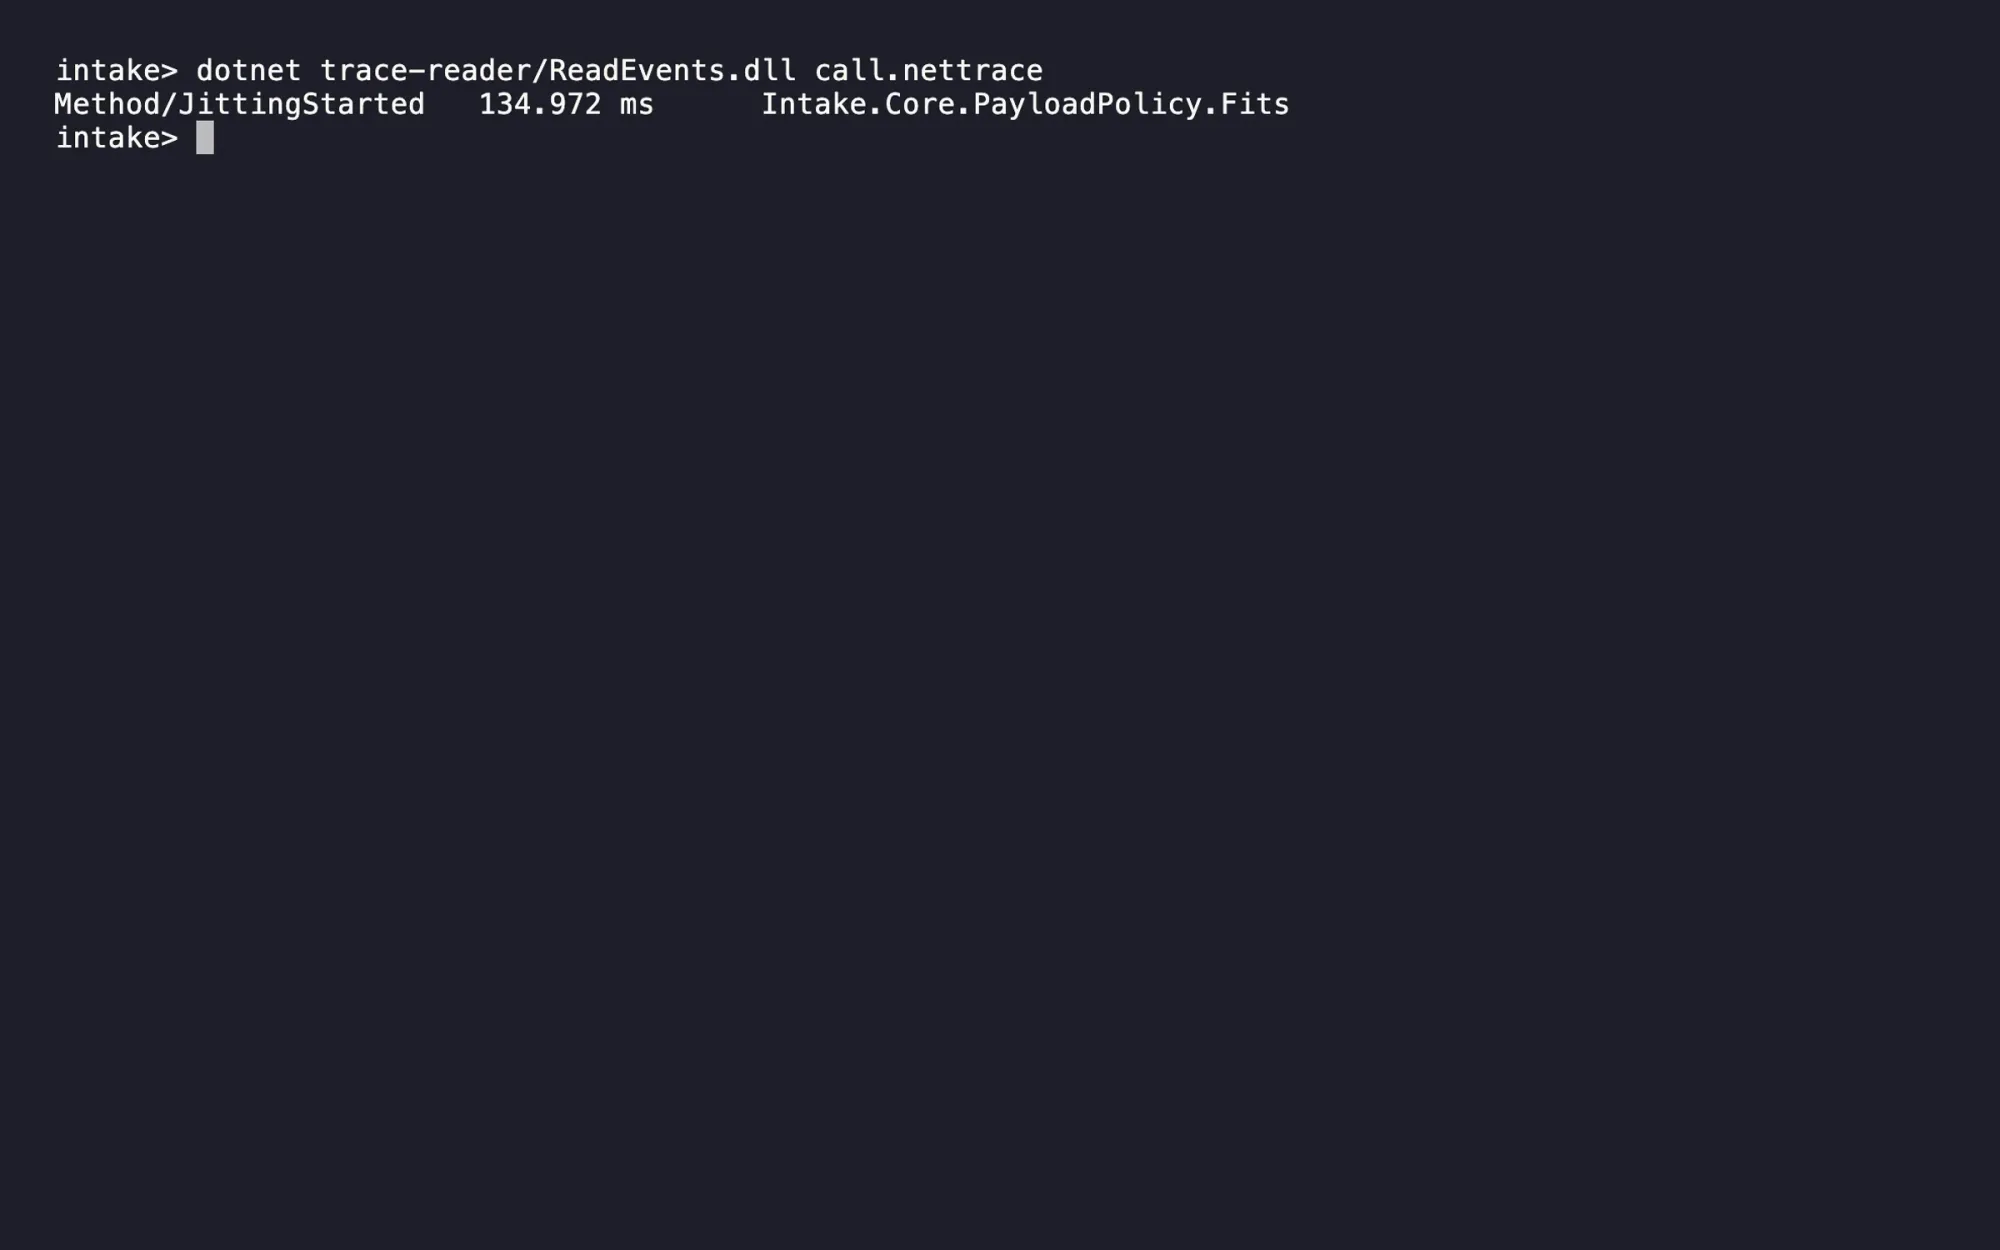
The trace identifies the method but says little about what the caller sees after preparation. Return to the two-call debugger experiment. Read the entry and target columns separately across the three stops. The former is the value the caller kept. The latter is the destination LLDB read from the slot used by the entry's branch. At the last two stops, disassembling the target shows the comparison itself. Fresh runs can choose different addresses.
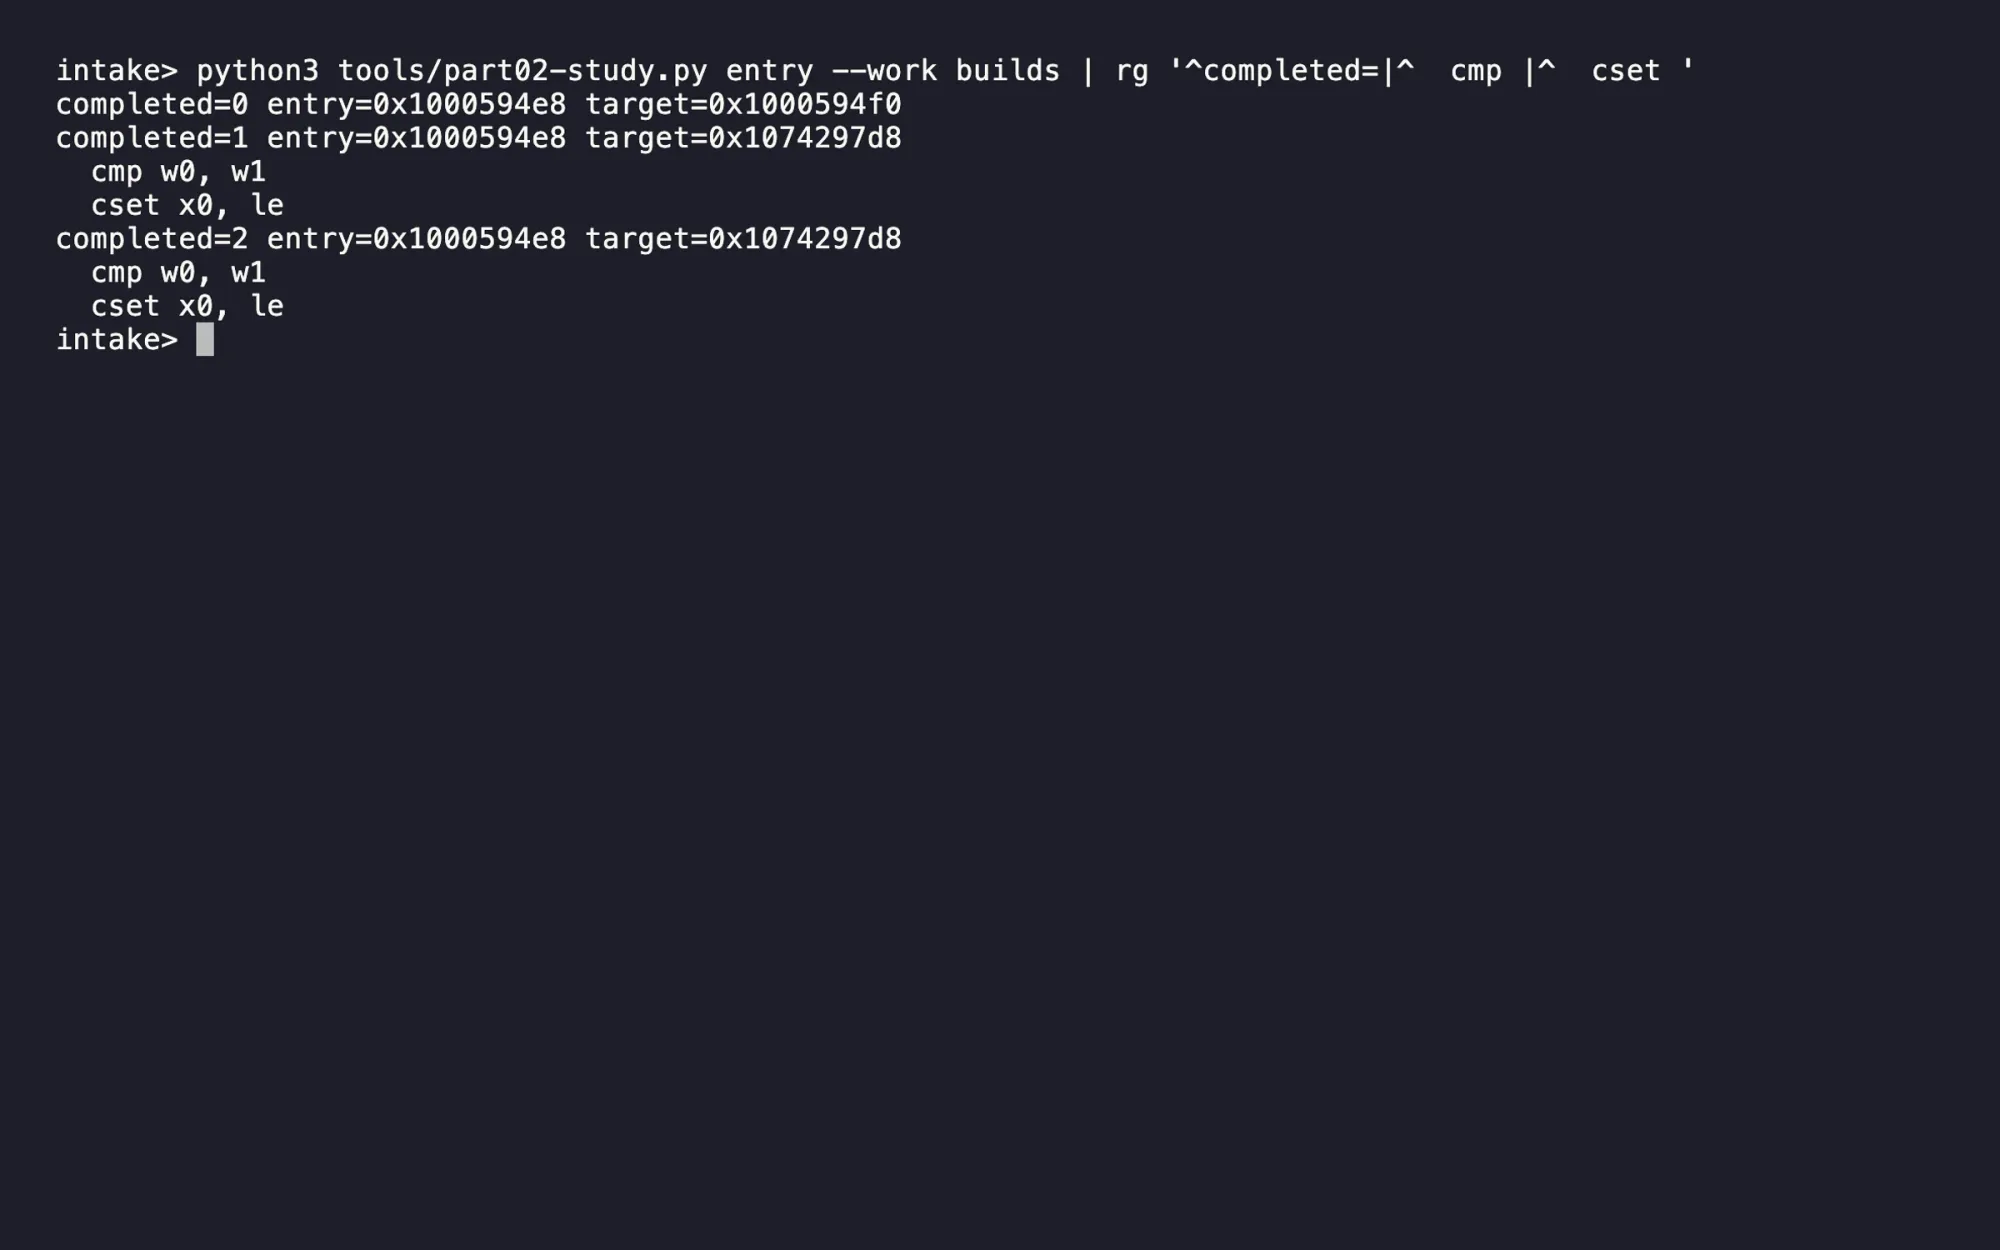
Together, the event and the changed target justify Dana's narrow conclusion. A new ordinary process can accept a health probe before this separate method has been compiled. A native release can contain a callable body before the first request. To explain a retry she still needs to follow a request from the client's attempt through the response. Loading pages into memory, initializing JSON metadata, opening a connection and queuing work can all take place in that interval.
Give the release memo a check it can repeat
Dana can improve the release gate today. A process-liveness check is useful in its own right. The submission path also has to accept the job and record it in this instance’s in-memory journal. The first example below returns from the real health endpoint. The second opens a disposable instance of the published API and posts a real fixture through its normal route. Look for the point at which a wrong status first becomes visible.
A successful liveness response
app.MapGet("/health", context =>
    TypedResults.Text("ready").ExecuteAsync(context));
The instance has serviced a request. That path never reads a job or applies the size rule.
An operation on a disposable journal
await using var server = await apps.StartServer("Api");
var http = server.Http;
// Earlier assertions exercise the empty journal and invalid input.
using var body = Json(await File.ReadAllTextAsync(apps.Fixture("job.json")));
using var accepted = await http.PostAsync("/jobs", body);
Assert.Equal(HttpStatusCode.Accepted, accepted.StatusCode);
Assert.Equal("/jobs", accepted.Headers.Location?.OriginalString);
The complete test also checks the acknowledgement, reads back the stored job and verifies that rejected requests leave it intact.
Use this form as an acceptance check against a private instance. A production readiness probe can run many times. Sending a real job on each poll would mutate the journal and could cause a downstream export. If the deployment needs warm-up before it receives traffic, design a one-time operation with disposable data and verify its side effects. A separate acceptance process can establish behavior. Warming one process cannot precompile the JIT body in a different running instance.
Here is the short version Dana can take to another service. Start at the left with the question someone actually asked, then choose the observation that answers it.
| Release question | What to inspect | What to keep |
|---|---|---|
| What rule did the C# compiler emit? | The application's managed assembly in an IL viewer | Method name, operands and return rule |
| Was the body present before launch? | The target's native image with its matching symbols | The named body and instructions from the file |
| Did this process compile the method? | Two fresh ordinary processes with the same JIT filter | Idle and called results, switches and tier header |
| When did that work begin? | A trace started before the exercise | The method event and its time reference |
| What made the first submission miss its deadline? | The actual published service, client request and related events | Verified response, timing distribution and competing explanations |
The first four observations can all be correct while the last question stays open. If your incident response starts with a machine-code listing, connect it back to the customer operation before choosing a publish mode. The same distinction helps when tracking down an allocation eliminated by the JIT or following who built an async state machine.
Which search was empty? A JIT filter reports bodies emitted during this process. Check its spelling with a known call, then inspect the caller, the tier and the possibility of precompiled code. A debugger searching a native file needs the right image and usable symbols. Finding a known symbol in that same image tests the second search. It tells you nothing about a JIT filter in another process.
- Choose one business operation and identify the method it reaches in the published build.
- Pair a deliberately idle path with a called path using the same file, switches and diagnostic filter.
- Compare the threshold and the first rejected input on both binaries.
- Record the runtime, target, tier and publisher settings beside a code listing.
- Keep customer latency open until someone measures the first correct response.
Run it on the files you would ship
Build from the extracted series directory. Use python3 tools/part02.py build and then python3 tools/part02.py verify. Windows readers can use py -3. The verification command starts both published executables, supplies four boundary inputs, tests invalid arguments and checks both diagnostic controls. Run il, native, idle, call and defaults through the same script to display each observation. Add --framework net10.0 to both the build and the case to inspect the other runtime.
To repeat the inlining board on Apple Silicon, run python3 tools/part02-study.py inline. Read the output for the caller as well as for the callee. In the download, compare inline-main.txt with inline-native-main.txt at the constant comparison, then open inline-native.txt for the two-register version.
The first paired experiment is traced on screen in lesson 01, When does this method become machine code?, of the companion video course. For the additional experiments here, open the README in src/Part02.MethodBody. The entry study needs an Apple Silicon Mac with LLDB. The trace study needs dotnet-trace. Both write local diagnostics and work without a service account.
Further reading
- Microsoft's managed execution process, from source through intermediate language
- CoreCLR method descriptors, precode and entry points in .NET 11
- Native AOT deployment and platform prerequisites
- The runtime method events emitted during compilation
- Runtime compilation settings, including tiered compilation and ReadyToRun
- Processor baselines and precompiled targets in .NET 11
Dana records where each kind of candidate gets its code. For the operator tool and the API's size check she now has a named method, a static native body, a positive JIT control and a first-call event. Part 1 exercised the worker and console on published files. Their first calls and their users’ waits still need traces and latency measurements of their own.
Ravi has one last objection. The optimized comparison on the Mac was already six instructions long. The default first version used ten, including stores immediately followed by loads. Why would a runtime spend time compiling a version it expects to replace?
Series · How .NET Runs Your Code, part 2 of 11. Previous · What a .NET release ships. Next · Why .NET compiles the same method twice.