Runtime Async in .NET 11: Who Builds the State Machine Now?
Runtime async changes where suspension is represented. A real two-library .NET 11 lab shows smaller compiler artifacts and lower allocation on some paths, while a controlled suspension case resists a universal speedup claim.
Explore the mechanism ↓
Reading tools Listen or translate
Read aloud
Uses an installed voice on your device.
Translate article
Machine translation. Code and evidence notes stay in English.
Original English text.
START WITH THE MECHANISM
Interactive companion and laboratory update: 12 November 2026. The editorial date places the topic on the timeline; this current explanation and its measured evidence retain their actual preparation and execution dates.
THE FULL INVESTIGATION
Runtime Async in .NET 11: Who Builds the State Machine Now?
Dates and technology context
This is a retrospective editorial timeline. Topic context: 10 November 2026. First publicly available: 12 November 2026. Current text, visuals and laboratory revisions were prepared on 12 November 2026.
All compiled artifacts, correctness checks, IL/JIT observations and allocation/timing tables were produced 2026-11-12. Keep those as the actual investigation date even if the editorial context is release day.
An await is a promise about how a method can continue, not a promise about how many objects the implementation must allocate. That distinction becomes unusually useful in .NET 11. The familiar C# programming model remains, while the responsibility for representing suspension can move from a compiler-generated state-machine type into the runtime.
It is tempting to turn that change into a slogan: async is cheaper now. The more interesting question is which boundaries became cheaper, which objects are still observable, and what an application needs to prove before taking advantage of the new implementation.
This article follows a small reference laboratory. Its two libraries compile the same workload source with different async lowering choices. A separate host checks results, controlled suspension, cancellation, exceptions and ambient context before collecting any timings. The experiment deliberately includes a synchronous control and a retained-task case, because a useful performance claim needs somewhere it could fail.
The article was prepared on 12 November 2026. The runtime under discussion is the released .NET 11 implementation, not an earlier nightly experiment. Results belong to the exact build and environment recorded with the laboratory, and the small scenarios do not establish the speed of a web service, database call or agent application.
The change is below the programming model
01 / See the idea
Two implementations of one source contract
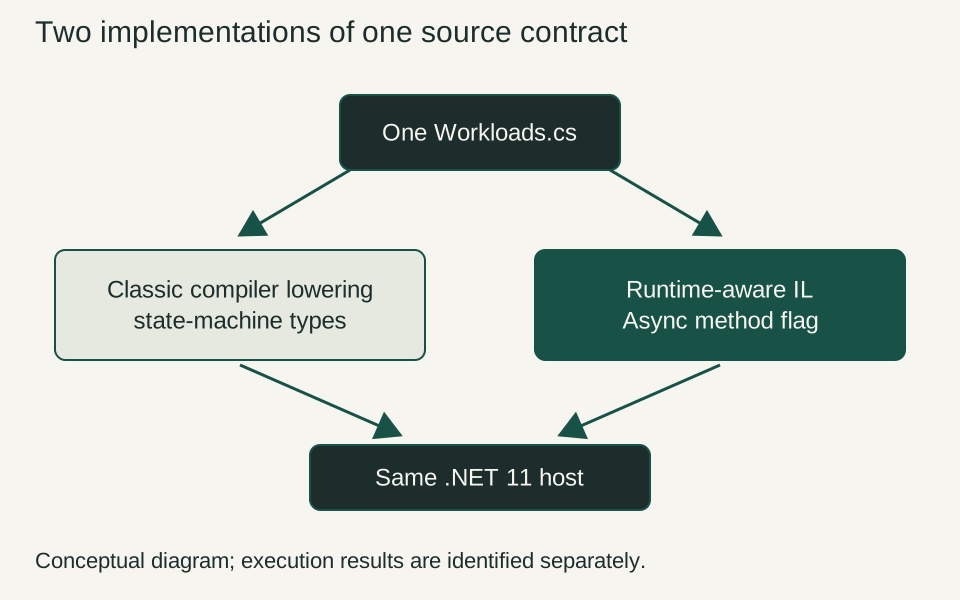
The two libraries share the workload file and execute under one runtime. The host keeps its own lowering fixed so that the comparison targets the library boundary.
Interpretation and evidence
- Verify the selected lowering.
- Keep the caller contract fixed.
- Separate IL size from native size.
Consider a method that awaits another method, adds one to its result and returns. The caller cares about the result, failure and completion behavior. The implementation must preserve enough information to finish the addition after the awaited work becomes available.
In the traditional compiler transformation, C# emits a representation of that suspended computation. The generated machinery contains the state and logic needed to resume. Moving this responsibility changes what appears in the assembly, but it does not remove the underlying need to remember unfinished work.
The official .NET 11 runtime documentation identifies Runtime Async as an opt-in project feature and gives the runtime-async=on compiler feature setting. It also distinguishes improved live stack traces from exception stack traces, which already receive their own cleanup. Those are separate claims from application throughput. Microsoft: .NET 11 runtime changes
Our first question is therefore representational: did the compiler actually emit a different form? A project file with an encouraging property is not sufficient evidence. Build properties can be misspelled, overridden or irrelevant to a method shape. If both assemblies contain the same generated state machines, comparing their timings would not test the intended treatment.
The laboratory records method implementation flags, generated types, IL byte lengths and assembly sizes. These observations tell us what the selected compiler produced. They do not by themselves establish how much native code the JIT ultimately creates, or how much memory the application retains after an operation.
That separation is the first useful habit: verify the implementation choice, then verify behavior, then discuss cost. Skipping directly to the final stopwatch can leave an experiment answering a different question from the one in its title.
One source file, two libraries, one host
The laboratory has three projects. Classic and Runtime both link the same Workloads.cs. The only source distinction is their namespace, which lets the host reference both assemblies without reflection on the timed path. Runner uses traditional lowering itself and invokes the selected library through delegates created before the measurement.
The SDK is pinned in a local global.json; the host targets net11.0 and requests runtime 11.0.0 without roll-forward. No global machine configuration is changed. The runtime-async library contains this setting:
<Features>runtime-async=on</Features>
The classic library explicitly disables that feature for its compilation. This design compares application-library lowering on the same runtime. It is intentionally not a .NET 10 versus .NET 11 comparison. Framework code, JIT changes and runtime configuration are shared between the two sides, which makes the treatment narrower and easier to explain.
Keeping the host separate also prevents an accidental confound. If the benchmark loop itself changed async implementation, a difference could include both the workload and the harness. Here the workload boundary remains visible. The price is that the public outer task is observed by a traditionally compiled caller. That is a real boundary, and we should not pretend it has disappeared.
The official performance discussion explains why direct async-to-async calls can create different optimization opportunities from boundaries where a task must exist as an object. It is a mechanism to investigate, not a license to reuse the article's benchmark numbers as our own. Microsoft: performance improvements in .NET 11
This is also why the laboratory does not start by changing public return types. Replacing Task<T> with ValueTask<T> changes the API's consumption contract as well as its implementation. First compare the same source and public shape. Then use the separate ValueTask scenario to examine a different design choice.
A small chain makes the boundary visible
The synchronous-completion Task scenario uses three methods. Each intermediate method does enough work after its await to make the composition clear. The result is deliberately outside the small integer values commonly associated with task-result caching, and the input varies within the loop.
public static async Task<int> TaskChain(int value)
    => await TaskMiddle(value) + 1;

private static async Task<int> TaskMiddle(int value)
    => await TaskLeaf(value) + 1;

private static async Task<int> TaskLeaf(int value)
    => await Task.FromResult(value + 1000);
These are the actual workload methods in the companion source, not an approximate rewrite of the measured code. Their business meaning is intentionally trivial. For input 17, the required result is 1019. The simplicity allows the experiment to concentrate on the representation of completion and composition rather than on an expensive algorithm hiding the relevant work.
There is a limitation in that strength. Real applications often await network or storage operations whose latency dominates several helper calls. A measurable reduction in this small chain does not establish a noticeable reduction in user response time. It might still reduce CPU or allocation pressure at sufficient volume, but that is another claim requiring another workload.
The source also has a direct synchronous function returning the same arithmetic result. This control does not use async at all. It helps identify the floor imposed by the loop, delegate invocation and arithmetic. If the control shifts substantially between otherwise equivalent processes, environmental variation deserves attention before we celebrate a difference in async code.
Do not subtract the control mechanically from every result and call the remainder the pure cost of await. Costs interact with optimization, inlining and execution layout. The control is a diagnostic comparison, not an algebraic guarantee that every component of execution is independently additive.
Suspension is an event, not a method name
02 / Watch the mechanism
A gate makes suspension observable
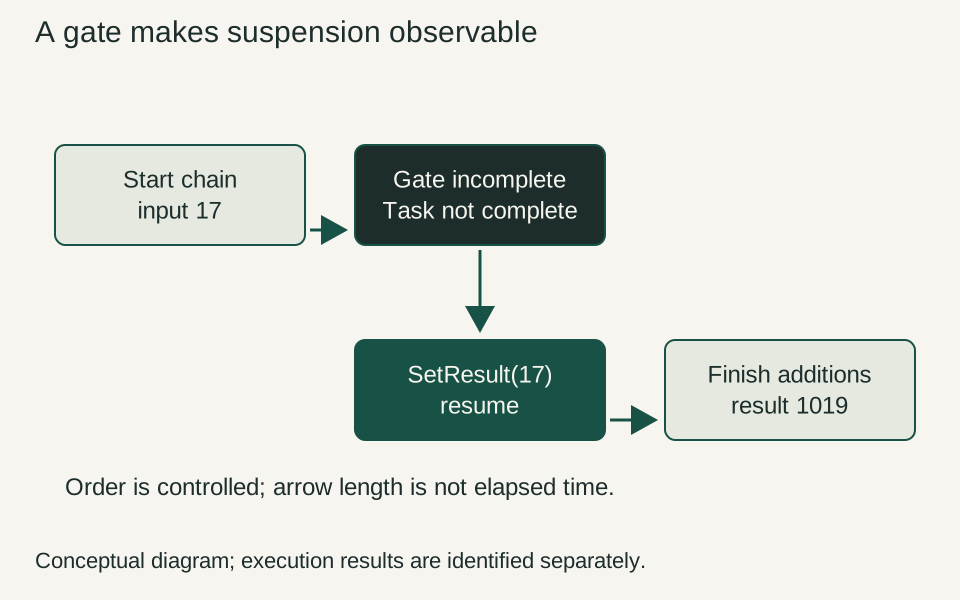
Static view. Play to see how the mechanism unfolds.
For input 17, the chain must remain incomplete before the gate opens and eventually return 1019. The path describes a controlled scenario, not a measured scheduling timeline.
Interpretation and evidence
- Incomplete is checked explicitly.
- State must survive the wait.
- Gate work belongs in the cost.
An async method can complete without suspending. Testing only completed awaitables therefore leaves the central lifecycle unexamined. The laboratory supplies an incomplete TaskCompletionSource<int> to a second chain and verifies that the returned task is not complete before opening the gate.
public static async Task<int> SuspendedChain(
    Task<int> gate, CancellationToken token)
    => await SuspendedMiddle(gate, token) + 1;

private static async Task<int> SuspendedMiddle(
    Task<int> gate, CancellationToken token)
    => await SuspendedLeaf(gate, token) + 1;

private static async Task<int> SuspendedLeaf(
    Task<int> gate, CancellationToken token)
{
    int value = await gate.ConfigureAwait(false);
    token.ThrowIfCancellationRequested();
    return value + 1000;
}
The gate is controlled by the caller, so the test has a definite before and after. It does not rely on a short delay happening to finish late enough. Before SetResult, the operation must remain incomplete. After completion, the arithmetic must include both continuation steps.
The measurement includes allocating and completing the gate. This is explicit in the report. It is not a measurement of a pure continuation allocator, a thread-pool scheduler, or an operating-system I/O completion. The default gate permits inline continuations; it does not deliberately schedule every continuation onto another worker. That makes it a narrow suspension/resumption experiment with less scheduling variation, while also limiting the environments it represents.
The runtime code-generation design describes a continuation-bearing calling convention and the need to preserve state across suspension. That document is implementation guidance. It should not be read as a promise that all historical draft restrictions describe every surface supported by the final compiler. Runtime code-generation responsibilities at the .NET 11 release tag
The practical implication is modest: unfinished work still needs representation. A different representation can be smaller or easier for the runtime to optimize, but suspension has not become free merely because a generated C# type is no longer present in an assembly inspection.
Correctness comes before the comparison
03 / See the idea
Behavior comes before speed
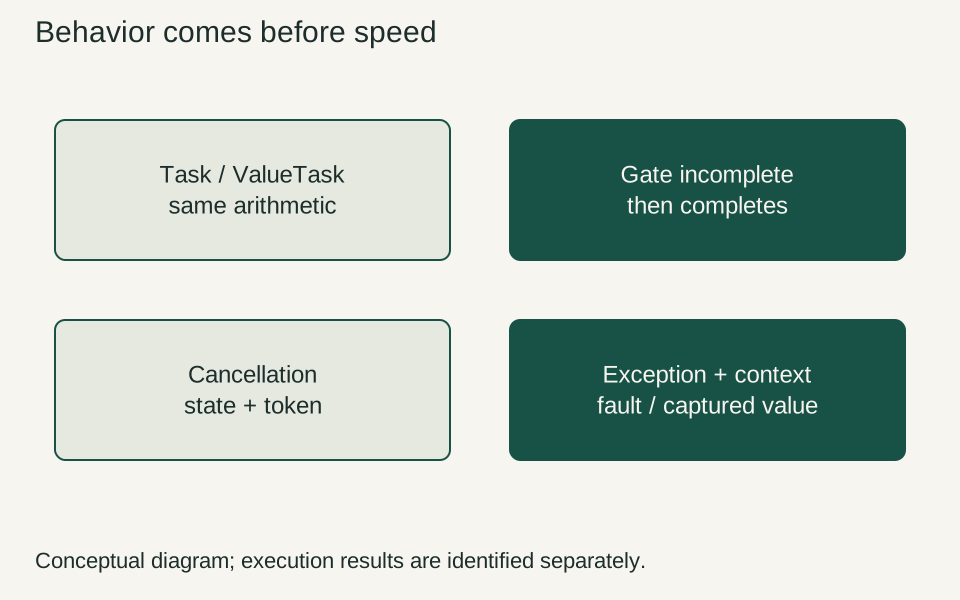
A cancelled token is inspected after the gate resumes, whereas a controlled exception faults the returned task. These are distinct outcomes, and a quick result cannot compensate for getting either wrong.
Interpretation and evidence
- Check result and task state.
- Keep cancellation timing explicit.
- Test the ambient context contract.
The correctness runner executes both libraries against independent expected results. It uses several input values, confirms real suspension, checks the resumed arithmetic, verifies cancellation state and token identity, checks the controlled exception, and examines the flow of an AsyncLocal value across the gate.
The cancellation case is intentionally precise. The token is cancelled while the method waits; opening the gate then allows the code to reach ThrowIfCancellationRequested. The test checks that the returned task is cancelled and that the observed exception carries the expected token. It does not claim that cancellation of the token itself interrupts the gate, because the source does not implement that behavior.
That distinction matters when reading examples. Passing a token somewhere in a method is not evidence that every await within the method observes it. A test should describe the actual contract: when cancellation is checked, what stops, and what outcome the caller receives.
The exception case similarly checks a failure after suspension. A method waits for the gate and then throws a known InvalidOperationException. The caller must observe that failure through the returned task. The test does not compare formatted stack-trace strings, because those strings are diagnostic presentation rather than the central behavioral invariant.
The ambient-context case captures one value before suspension, changes the caller's current value and then opens the gate. The continuation is expected to observe the value associated with its own asynchronous flow. This is a targeted check of an important responsibility, not comprehensive proof of compatibility for every custom synchronization context or hosting environment.
Finally, the caller retains a returned Task<int> and awaits it twice. The test protects the public Task contract while the internal implementation changes. The separate ValueTask scenario is consumed once per returned value; we do not infer that a reusable Task usage pattern automatically transfers to every ValueTask. The documented consumption restrictions are part of that API choice. ValueTask consumption contract
Passing these checks does not certify an application migration. They cover the shapes in this laboratory. A real service may use custom awaiters, custom builders, async streams, UI dispatching, unusual exception filters or dependencies built by other compiler versions. Those shapes require their own coverage.
Inspect the artifact you actually built
05 / See the idea
Observed artifacts answer different questions
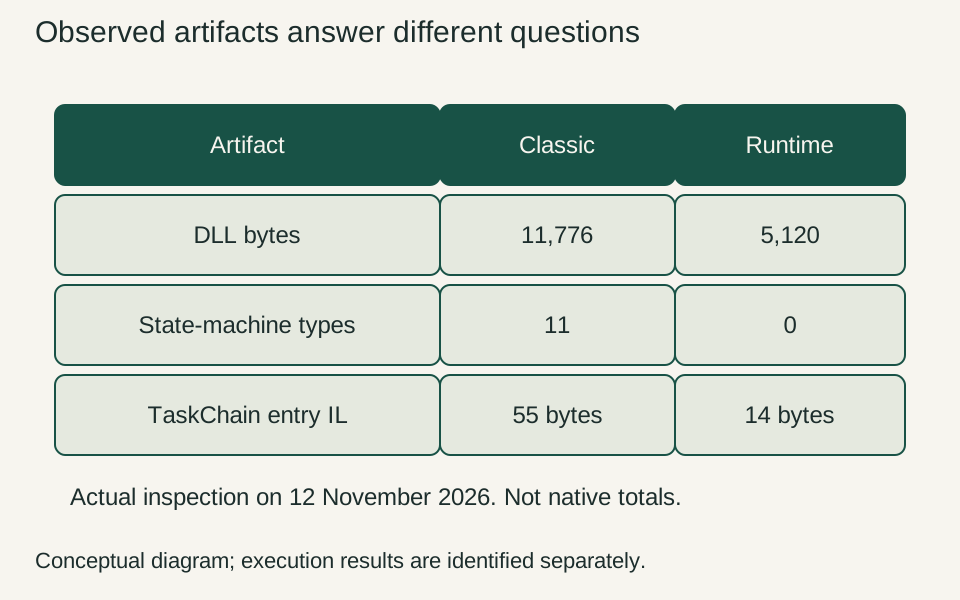
Inspection found 11 generated state-machine types in Classic and none in Runtime. The entry-method IL shrank, but the diagnostic JIT listing contains additional native entry paths, so these are not interchangeable size metrics.
Interpretation and evidence
- DLL bytes are file bytes.
- Entry IL excludes generated methods.
- Native paths need separate accounting.
The inspection command records both assemblies rather than reading the project file and assuming success. For each workload method it reports the implementation flags, the presence of an AsyncStateMachineAttribute, the byte length of its IL and a hexadecimal representation of the body. It also enumerates types implementing IAsyncStateMachine.
An assembly size is a file size. An IL body length is a count of IL bytes. Neither is the size of all generated native code, the size of a suspended operation, or the process's retained heap. Keeping those units distinct prevents a useful representation result from becoming an exaggerated memory claim.
The release-tagged runtime specification defines the async method flag and describes special handling for the Task and ValueTask return families. The document labels itself as a specification draft, so we use it to interpret observed metadata rather than to announce that every sentence is a final public compatibility contract. Runtime async specification at the .NET 11 release tag
The compiler design explains how C# can lower await expressions into runtime-aware operations while continuing to own language-level binding and rewriting responsibilities. That is why “the compiler does nothing” would be the wrong conclusion. Moving suspension machinery does not remove the compiler from the pipeline. Roslyn runtime async design
For a deeper native-code investigation, the repository includes an optional JIT-listing command. That diagnostic run must remain separate from the timed run because diagnostic output changes the work performed by the process. The useful question is whether the listing supports a specific mechanism suggested by the allocation or timing result, not whether a shorter-looking dump is aesthetically pleasing.
The actual inspection found 11 generated state-machine types in Classic.dll, whose size was 11,776 bytes, and none in Runtime.dll, whose size was 5,120 bytes. TaskChain had 55 bytes of entry-method IL in Classic and 14 bytes with the Async implementation flag in Runtime. The classic count excludes the generated MoveNext body, so dividing those two entry lengths would not describe total method cost.
A separate diagnostic execution, with tiered compilation disabled for the listing, produced a 72-byte classic public entry, a 536-byte runtime-async public Task-returning entry and a 349-byte runtime-async integer-returning path. The classic entry calls its generated state-machine infrastructure; its small listing is not the entire implementation. These observations are a useful counterexample to the assumption that a smaller assembly or IL body necessarily means a smaller public native entry point.
Inside the runtime-async integer-returning listing, the observed call goes to TaskMiddle(int):int, followed by a test of the continuation return and the addition to the value. That connects the high-level explanation to actual generated instructions. It does not establish total native footprint, and the diagnostic's non-tiered configuration is deliberately different from the default-tiering timed processes. Compilation configuration semantics
Measure the public boundary honestly
04 / See the idea
Where this benchmark starts and stops
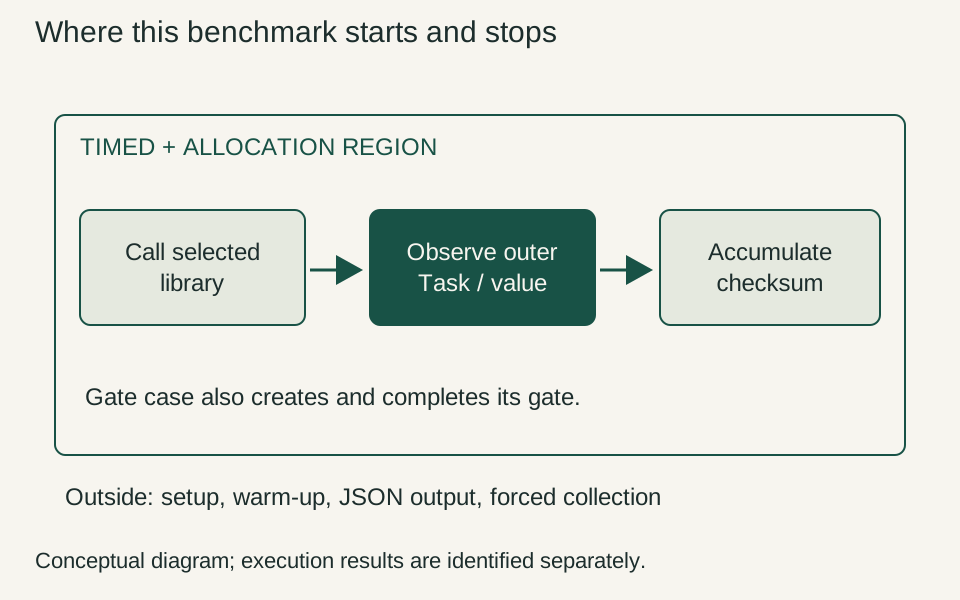
The caller always observes the outer Task, even when internal composition becomes cheaper. Process-wide allocation covers work inside this process, not just the initiating thread.
Interpretation and evidence
- Outer Task remains observable.
- Gate allocation is included.
- No network or I/O is measured.
The host offers five measurement scenarios: direct arithmetic, synchronously completing Task composition, synchronously completing ValueTask composition, a controlled suspended Task chain, and a Task result retained in a small caller-owned array.
Each process selects one implementation and one scenario. It records a first invocation separately, performs a bounded warm-up, and then collects seven raw samples. Each sample checks its checksum after timing. The report includes elapsed timestamp ticks, timestamp frequency, nanoseconds per operation, total allocated bytes per operation and collection counts.
This is a small transparent BCL harness, not BenchmarkDotNet. That choice keeps dependencies and generated benchmark projects out of this first implementation probe. It also means the report should not claim BenchmarkDotNet's statistical machinery, automatic iteration calibration or diagnostic guarantees. The full loop and its measurement boundaries are short enough to inspect.
Allocation uses a process-wide managed-allocation counter. It excludes native allocation and uses the precise option outside the timed interval. A current-thread allocation counter would be an especially poor default for an experiment that may involve continuations, because work can move away from the initiating thread. Process-wide accounting can include unrelated managed activity within that process, which is another reason to keep the host small and preserve the raw samples. GC.GetTotalAllocatedBytes
The first-invocation observation is not application cold-start time. The operating system has already launched the process, the runtime has started and the host has parsed its arguments. The observation covers the first selected operation at that point. A production cold-start claim would need a different outer boundary.
The runner requests full collections between samples, outside the timed region. That makes the laboratory easier to repeat, but it is not representative of every steady-state service. Collections still triggered during a measured loop are reported. A follow-up production-shaped experiment should use an appropriate arrival pattern and GC lifecycle rather than copying this setup blindly.
The lead executes measurement processes sequentially in an exclusive local measurement window. That avoids intentionally competing benchmark workers, but it does not turn a shared Windows machine into a dedicated performance laboratory. Background operating-system activity remains a limitation. Tiny elapsed-time differences deserve less confidence than a repeated, structurally explained allocation difference.
The result section must follow the evidence
06 / See the idea
Measured medians: lower allocation is not always faster
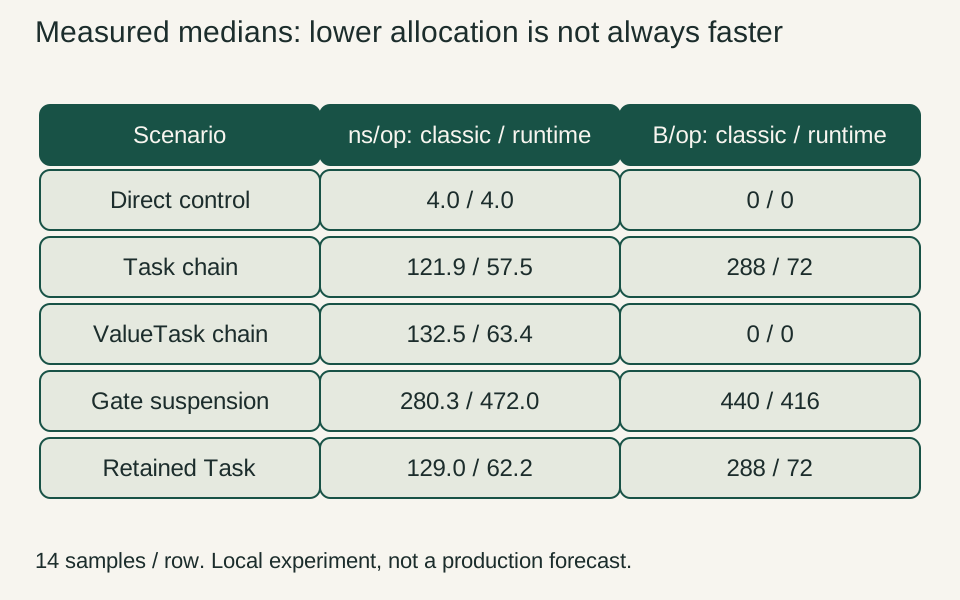
The completed Task chain used fewer managed bytes and less median elapsed time in this run. The gate case used slightly fewer bytes but had a higher median time, with wide sample ranges.
Interpretation and evidence
- Do not equate fewer bytes with faster completion.
- Inspect the raw ranges and sequence.
- These are small local workloads, not service benchmarks.
All 30 behavioral checks passed on .NET 11.0.0. The subsequent measurement run completed on 12 November 2026 with all 20 child processes returning exit code zero. The host reported Windows build 10.0.20348, x64, 64 logical processors and workstation GC. Both tiered compilation and tiered PGO were left at their runtime defaults. These are local laboratory observations, not product-team benchmarks.
Each row below contains 14 samples from two separate processes, with 100,000 operations per sample. The second round reversed the classic/runtime order. The interval shown is the minimum and maximum sample mean, not a confidence interval or a per-request latency distribution. Values are rounded here; the JSON retains the originals.
| Scenario | Lowering | Median ns/op | Sample-mean range ns/op | Managed bytes/op |
|---|---|---|---|---|
| Direct synchronous control | Classic | 4.02 | 3.97–4.95 | 0 |
| Direct synchronous control | Runtime | 3.99 | 3.96–4.05 | 0 |
| Completed Task chain | Classic | 121.92 | 118.17–144.62 | 288 |
| Completed Task chain | Runtime | 57.52 | 57.23–80.66 | 72 |
| Completed ValueTask chain | Classic | 132.51 | 131.90–156.94 | 0 |
| Completed ValueTask chain | Runtime | 63.39 | 62.83–69.00 | 0 |
| Controlled gate suspension | Classic | 280.25 | 264.10–1,014.87 | 440 |
| Controlled gate suspension | Runtime | 472.04 | 213.53–506.57 | 416 |
| Retained outer Task | Classic | 129.01 | 126.75–157.61 | 288 |
| Retained outer Task | Runtime | 62.24 | 61.77–88.90 | 72 |
The managed allocation values were identical across the samples within each row. The completed Task chain is the clearest allocation result: this boundary used 288 bytes per operation in the classic library and 72 in the runtime-async library. That is a reduction of 216 measured bytes per operation for this source and input range. It is not zero allocation, and the retained outer-Task case preserves that point rather than making the public object disappear.
The ValueTask chain observed zero managed bytes in both variants. Runtime async therefore did not improve that row's allocation count, although its measured elapsed time differed. The direct synchronous control also has no async allocation to remove. These cases stop the result from becoming an automatic claim about every method in a project.
The gate result is more uncomfortable and more informative. Its runtime-async median was higher despite a slightly lower allocation count, and both sides had substantial timing variation. The runtime sample range even includes a lower minimum than the classic range. This brief default-tiering run does not establish a stable production regression, nor does it support advertising universal speedup. It demonstrates that the chosen suspension workload needs a separate explanation rather than extrapolation from synchronous completion.
The fixed warm-up is another limit. It does not prove that every tiered or profile-guided compilation transition had finished before sampling. The raw sequence is retained precisely so a later investigator can inspect whether results move over time. A serious latency commitment would need a longer, independently justified measurement protocol on a controlled machine and the actual scheduling/I/O pattern.
The files include a first-invocation observation for every process, but this article does not rank cold performance from two such observations. They are diagnostic evidence that the boundary was recorded, not a robust cold-start study. Publishing a confident startup percentage would exceed what the experiment established.
Interpret a result in stages. First ask whether the correctness checks passed for both variants. Next ask whether inspection confirms different lowering. Then compare the same scenario across the two libraries. Finally ask whether the difference is large and stable enough to matter for a workload that resembles the intended application.
The direct control is particularly useful here. Its source has no await, so there is no reason to attribute ordinary timing variation in that row to a new async state machine. The retained-task row asks a different question: what happens when the caller explicitly keeps the promised result object? That object is part of the observable boundary even if internal tasks become avoidable.
The ValueTask row is not an instruction to replace every Task API. It provides an alternative shape whose tradeoffs need to be understood at the consuming boundary. If it already avoids a cost in the synchronous case, runtime async may have less left to remove. If the real API frequently suspends or consumers need reusable completion objects, the decision can change.
The gate row must be read with its fixed work attached. It includes creating the gate and completing it, not only the three workload methods. A remaining allocation does not prove that the transformation failed; it can belong to an object that the harness deliberately requires. Conversely, a lower total allocation does not tell us which object vanished without additional evidence.
Reproduce the claim, then change one assumption
Use the companion's lab directory as the working directory so its global.json selects SDK 11.0.100. The source has no third-party package dependencies. The build still needs the matching .NET targeting pack supplied by that SDK.
dotnet build Runner/Runner.csproj -c Release --nologo
dotnet Runner/bin/Release/net11.0/Runner.dll check
dotnet Runner/bin/Release/net11.0/Runner.dll inspect
dotnet Runner/bin/Release/net11.0/Runner.dll measure classic task 100000
dotnet Runner/bin/Release/net11.0/Runner.dll measure runtime task 100000
Run timed processes sequentially, with unrelated work minimized. The orchestration script preserves stdout, stderr, exit status and all samples. It uses the same five scenarios and reversed order described above. Do not compare a freshly rebuilt binary with an old report whose source identity is unknown.
The most useful extension is not simply more iterations. Change the assumption that matters to your application. If continuations resume through a scheduler, use a controlled scheduler scenario. If callers retain many tasks concurrently, model that lifetime rather than a 64-slot ring. If the leaf is usually synchronous but occasionally performs I/O, preserve that distribution and its failure behavior.
Keep the existing correctness checks while extending the workload. Add checks when the new assumption creates a new responsibility. A scheduler case may need context-affinity verification; a custom awaiter may need completion-race checks. A larger benchmark that silently changes the contract is less informative than this small one with honest boundaries.
Why zero allocation is the wrong default promise
Zero allocation is a statement about a boundary under specified conditions. It is not a property bestowed on a method by placing the word async in a newer project.
A caller may need a Task object to store, share or inspect. A suspended computation may need state to survive beyond its current stack frame. A gate, cancellation source, exception or diagnostic record may allocate independently of the particular lowering decision. A measurement that excludes those components can be valid, but its boundary must travel with the number.
Even a reported zero from a counter deserves care. The counter has a scope and a resolution, the workload has a selected path, and the runtime may cache or reuse objects. The appropriate conclusion is that this measurement observed no allocation within its defined accounting boundary, not that the entire application can never allocate.
Low allocation can be valuable without reaching zero. Avoiding unnecessary intermediate objects may reduce collection pressure and make a heavily used helper chain more economical. The engineering question remains whether that improvement changes a meaningful constraint and whether the resulting code remains understandable.
Flattening every helper method to avoid yesterday's implementation cost can create a different burden. It can make authorization, retry and validation logic harder to review. A runtime improvement that makes decomposition cheaper is interesting partly because it can reduce the tension between readable boundaries and efficient execution.
That is still a hypothesis about an application, not permission to skip measurement. A good helper boundary expresses a responsibility. A needless abstraction can remain needless even if its allocation cost disappears. Performance and design should inform one another without pretending that one metric chooses the architecture.
Choose the next experiment from the remaining uncertainty
This laboratory is deliberately not an HTTP benchmark. If the motivating problem is a service's tail latency, the next experiment should place the relevant chain in that service's real operation boundary. Preserve errors, cancellation and unfinished requests, and compare at the same offered demand.
If the motivating problem is retained memory, allocation counts are insufficient. Inspect object lifetimes, queue depth and the point at which ownership ends. A smaller allocation rate does not repair a reference that retains a document forever. If the problem is a blocked thread pool, changing async lowering does not make synchronous blocking disappear.
If the motivating problem is deployment size, measure the actual packaging mode. A class-library DLL comparison is useful evidence about compiler output but not a complete NativeAOT, ReadyToRun or container-size comparison. Each mode adds its own transformations and retained dependencies.
If the motivating problem is debugging, capture the relevant live stack and use the debugger actually supported by the team. Do not recycle an exception stack as evidence of live-stack improvements, or use a static editor screenshot to imply a debugger session. Different diagnostic claims require different observations.
The adoption decision can therefore remain small. Enable the feature in a bounded project, establish that the compiler used it, run the application's meaningful behavioral checks, and compare the workload that motivated the change. Keep a known configuration available for rollback and record any method shapes left outside the comparison.
The important lesson is not that the state machine vanished. The responsibility for representing it moved, giving the runtime different opportunities to optimize composition. Our responsibility remains recognizable: choose the boundary, preserve the contract, inspect the artifact and let an actual observation determine how far the conclusion can go.
Source code and execution evidence
Download the complete lab, source record and raw execution results. This package supports the specific execution claims in this article. It is not a production certification.