

How .NET Runs Your Code, part 10 of 11. Previous, How to Compare .NET JIT and Native AOT by CPU per Completed Job. Next, JIT, ReadyToRun or Native AOT? Four .NET Release Decisions.
Suppose Intake’s operations dashboard gets much more popular while job submissions stay flat. The service’s memory graph climbs. Dana, the release owner on our invented team, wants to know whether the journal is leaking. She reads the QueuedJob count in a heap snapshot after garbage collection, sends 2,000 successful GET /jobs requests, then takes another snapshot. Both counts are 64. Would you close the incident?
In the isolated Part10.Memory API, a read builds a fresh response around existing jobs. Two explanations fit the rising graph. Short-lived response objects can die while the runtime keeps pages ready for reuse. A long-lived publisher could also keep completed views reachable. Both paths allocate memory and they can coexist. Which objects would each leave after collection?
- The operating system’s resident set includes executable pages, runtime data and managed objects. A smaller process can still have a larger reported managed heap.
- After the same 2,000 reads, the subscribing build retained 2,000 views. Unsubscribing at response completion removed the exact view row from the collected heap.
- The real root ran through the journal’s static event. In this dump the .NET debugger extension (SOS) attached a neighboring field’s name to that edge. Reading the two slots independently identified the owner.
- The ordinary Mac and Windows builds revealed the view’s owner. Native AOT on macOS, Windows and both Linux targets supplied counters and aggregate heap totals, with zero type rows in all four reports.
A process, a heap and a surviving object answer different questions
Ravi first inspects the process. Its resident pages can be file-backed or anonymous. Linux and macOS report resident set size (RSS). The Windows working set counts pageable memory currently resident for the process. Shared pages can contribute to more than one process reading. A container memory charge uses a different accounting boundary again. Windows working sets · Linux process memory fields.
Inside .NET, the garbage collector (GC) manages the object heap. The lifetime allocation counter grows with each new managed allocation, even when the GC later reuses the storage. A heap snapshot taken with an induced collection shows survivors. To explain why one survived, trace its references back to a root, a reference the runtime treats as live.
On the Mac, the ordinary service’s resident set after the seed and before attaching tools was 88,719,360 bytes. Its subsequent baseline GC snapshot reported 1,091,451 heap bytes. The native service’s corresponding resident set was only 28,049,408 bytes, yet its snapshot reported 2,711,484 heap bytes. Subtracting the later heap snapshot from the earlier resident set would misclassify the difference as “native memory.” Which mapped pages can Ravi identify directly? Measuring memory and finding its owner.
A native image changes which files supply executable pages
Ravi has three releases of the same HTTP service. The ordinary build sends application intermediate language (IL) to the just-in-time compiler (JIT). ReadyToRun supplies precompiled application code and keeps the runtime and its JIT. Native AOT links machine code into the executable ahead of time. Before any jobs have been accepted, which of those differences can you see in a map?
| Look for | Ordinary and ReadyToRun | Native AOT |
|---|---|---|
| Application code | Launcher and intake-memory.dll mapped separately. | Linked intake-memory executable. |
| Runtime and JIT images | libcoreclr.dylib and libclrjit.dylib both mapped. | No mapping for either of those two files. The program still carries runtime support. |
| Managed job objects | All three modes have a garbage collector. An OS map can describe a region’s pages and permissions. To name the surviving objects inside, ask a heap tool. | |
The same distinction is measurable on other operating systems. At the first Windows JIT observation, the JIT compiler image accounted for 1,773,568 resident bytes out of 2,433,024 committed bytes in its mapped regions. At the first Linux x64 JIT observation, the JIT image’s resident pages accounted for 3,944,448 bytes and runtime double-mapped regions for 8,364,032. The latter figure includes mappings of the runtime’s executable storage. It is not a sum of fresh method-body sizes. Neither system attributed all its remaining anonymous pages to the managed heap.
Use each receiver as its own control. Start five fresh processes for each publish mode. The first reading follows the listener opening and one observation of the empty journal. The second follows 64 accepted jobs and one read that checks all 64. Each cell pairs the medians from those five processes. One mebibyte (MiB) is 1,048,576 bytes.
| Receiver and OS measure | JIT | ReadyToRun | Native AOT |
|---|---|---|---|
macOS Arm64, Apple M3 Max · ps RSS | 82.98 → 85.47 | 83.25 → 85.67 | 26.56 → 26.78 |
Windows x64, AMD EPYC 7502P · WorkingSetSize | 47.73 → 51.48 | 47.77 → 51.50 | 25.88 → 26.39 |
Linux x64 container, AMD EPYC 7502P · VmRSS | 66.41 → 68.27 | 66.64 → 69.00 | 25.79 → 25.84 |
Read across a row to see what changing the publish did under the same OS gauge. The native API occupied fewer resident pages at both stops on each of these receivers. The Windows and Linux x64 runs used the same EPYC host. Docker ran the Linux service under Windows Subsystem for Linux 2 (WSL2), with a Linux kernel and its own memory accounting. The Mac comparison changes hardware as well. Establishing a CPU or OS effect would require additional controlled runs.
If the question is “which pages?”, switch from the process total to the map on that receiver. Apple’s vmmap describes virtual regions and sharing. Windows lets you separate the committed address ranges from pages in the current working set. Linux smaps provides resident bytes per mapping and proportional set size (PSS), which divides the cost of a shared page across processes. The table uses VmRSS. PSS and the Mac’s physical-footprint field answer different accounting questions. None of these fields identifies which application object still holds a completed view. Apple’s guide to virtual memory regions · Linux smaps accounting.
A container can change how many heaps the runtime uses
Server GC can use multiple heaps. Its Dynamic Adaptation To Application Sizes (DATAS) policy can adapt memory use to long-lived data. A collector still has to keep any view a live delegate can reach. How DATAS adapts the server collector.
In a Linux x64 container limited to 512 MiB, the server collector reported HeapCount=2 at two CPUs and 8 at eight CPUs. The workstation collector reported 1 in both cases. Ordinary and native builds showed the same configuration differences. The reported GC budget was 402,653,184 bytes (384 MiB). The operating system applies the container limit to more than the GC.
At the observation point, GCDynamicAdaptationMode was 0 with the adaptive switch off and 1 with it on. The Linux experiment enforced a CPU quota. The Mac and Windows controls overrode the count visible to the runtime while leaving OS scheduling unchanged. Steady pause distributions remain open. GC configuration, limits and heap count.
The product rule can require a growing heap row
Lena first removes the dashboard’s event subscription entirely. In a fresh ordinary process she posts 64 jobs and checks every acknowledgement, including the assigned ID. The snapshot tool induces a full collection and reports the exact row Intake.Contracts.QueuedJob. After 64 verified reads it still contains 64 instances. Repeat from a fresh seed, this time appending 64 additional jobs. Predict the second count before reading the result.
| Mac Arm64, .NET 11 JIT | Seed survivor count | After the operation |
|---|---|---|
| 64 reads, no subscription | 64 | 64 |
| 64 accepted appends | 64 | 128 |
| Acknowledge the 64 appended jobs | 128 before drain | 64 original jobs |
The append grows the row on purpose. In the dump, job ID 65 is reachable through JobJournal, its dictionary and an entry array. That is where an unacknowledged export belongs. A name collision in a heap report could send an investigator in the wrong direction, so compare the fully qualified type and assembly. A similarly named JSON type description or an array of references answers another question. These snapshots can suspend the target, so Lena takes them on disposable processes. How dotnet-gcdump collects its heap graph.
The flat row conceals 2,000 completed dashboard views
Restore a tempting convenience. Each request opens a SnapshotView that subscribes to the journal’s static Changed event, so the view can hear about invalidations. The event can live for the process lifetime. The HTTP caller needs the array of jobs only through response completion. If each read sees the same 64 jobs, which row would disclose that 2,000 arrays survived?
The Mac JIT snapshot still contained 64 jobs. It also contained 2,000 SnapshotView objects, 2,000 JobQueue wrappers and 2,000 QueuedJob[] arrays. Each array refers to existing jobs. Follow one view through the figure. Which edge must disappear when its response ends, and which owner must keep its jobs?
Detaching the handler breaks the static event’s path to the completed view
- The handler builds a view over the journal’s jobs. An event delegate can now reach that view while the handler writes the response.
- After the subscribing process completes all the reads, its event still has 2,000 subscribers. The collected graph contains one view for each.
- Switch to the separate control process. Its completion callback disconnects the view from the publisher, while the journal continues to own its pending jobs.
- After the same 2,000 reads, the control has zero subscribers and no exact view or queue row. Both processes still have 64 jobs.
Mac Arm64. Counts from jit-leaky.json and jit-detached.json in results/mac/part10. Arrows summarize references. The detachment steps follow a fresh process.
The control detaches the view at response completion and on a serialization failure. Its clients receive the same jobs. Each candidate started with a fresh heap, so compare it with its own seed. Should a successful fix return the entire heap to its starting size?
The detached heap still ends above its own baseline
| Dashboard handling | Seed | After reads |
|---|---|---|
| leaky | 1091451 | 2609319 |
| detached | 1069047 | 1292619 |
- Compare each service against its own snapshot after 64 accepted jobs. These are separate fresh processes.
- Each process then handled 2,000 identical reads. A second induced collection supplied the comparable heap totals.
- The detached control still allocates and still owns its journal. Its after-snapshot has no exact SnapshotView or JobQueue row.
GC heap bytes reported by dotnet-gcdump on Mac Arm64. The original leaky and detached heap reports are in results/mac/part10.
The subscribing heap went from 13,970 to 24,300 objects. The detached heap ended with 16,486, above its seed, but the view and queue rows disappeared. On .NET 10.0.15 the Mac repeat likewise found 2,000 views after subscribing and no view row after detaching. The agreement concerns the lifetime of that type.
Allocation counts the work even when the objects die
Try diagnosing the same two Mac runs from resident memory alone. After the reads, before the second heap collection, the still-subscribed process had 96.58 MiB resident and the detached process had 97.09 MiB. Picking the larger reading would send you to the process with no surviving views. These are single observations from different processes. They show why the gauge cannot identify the owner.
Could allocating the response still be worth optimizing? In a separate detached run without diagnostic clients, GC.GetTotalAllocatedBytes rose from 2,026,056 to 33,202,984 bytes across the same 2,000 reads. The subscriber count was zero at both stops. The difference, 31,176,928 bytes, includes the request, response and observations. To locate the code creating those bytes, collect allocation stacks during the operation. Establishing a CPU or pause cost needs a separate workload measurement. To explain a surviving object, follow its incoming references. What the process allocation counter measures.
The counter CSVs track dotnet.gc.heap.total_allocated alongside the most recently collected generation-2 size. Generation 2 holds older managed objects. When reading the Mac and Windows append counters, mark the collections induced by the diagnostic tool. Pause or throughput decisions need representative work on the intended receiver.
Do you need to keep the temperatures after counting them?
Suppose the dashboard needs just one number from a day of sensor readings: how many exceeded 85 °C? The importer can parse all 86,400 values into an int[] and then count them. It can also increment the count as each temperature is parsed. Which allocation disappears if you choose the second approach?
On the M3 Max, EPYC and Xeon, counting during parsing saved a median 337.6 KiB of managed allocations per daily import compared with the scalar array version. On a 37-reading file it saved 176 bytes. All three versions still read the whole file into a byte array. Switching only the final count to SIMD kept the array of temperatures. Part 9 compares the times to import the same files.
If the count is the only output, you can drop the intermediate array. If the operator will try several thresholds on the same readings, keeping it lets you scan again without reopening and parsing the file. The measurement used GC.GetAllocatedBytesForCurrentThread() around the synchronous imports. To find out whether the change also reduces GC pauses, measure pause time under your actual arrival rate. What the allocation counter measures.
How much memory does an importer keep between alarms?
Dana can leave the temperature importer listening so the next sensor file arrives in a process that is already running. What would she reserve on the worker node? Start the importer, wait for its READY line, then take the first reading before sending a file. Compare it with the reading after 32 checked alarms and again after one second waiting for more input.
| Receiver and OS counter | At READY | After 32 files | After 1 s idle |
|---|---|---|---|
| Apple M3 Max, macOS, RSS | 38.1 | 39.0 | 39.1 |
| AMD EPYC 7502P, Windows, working set | 15.2 | 16.2 | 16.2 |
| Intel Xeon W-2295, Linux, RSS | 22.9 | 24.1 | 24.1 |
On the M3 Max, the waiting worker had 39.1 MiB resident. Dana can compare that operating point with the alarm latency she saves by keeping the worker ready. Each process total includes pages that other workers may share. To size a deployment with one worker per tenant, measure node or container memory with the intended number of live workers. The probe is bench/temperature/ArrivalImport/footprint.py. The nine runs are in results/temperature-arrivals/footprint/. Compare ready-to-alarm times for the same importer in part 8.
Follow the event’s delegate, then check the static slot
A root path names the owner that counting objects cannot. In an ordinary Mac heap dump, select one concrete SnapshotView address from dumpheap and ask the SOS debugger extension for gcroot. Read from the strong handle through the reference array to the delegate, its invocation list and the individual action. The capture repeats the check on a fresh instance after 2,000 reads. The subsequent slot comparison uses the separate reference dump.
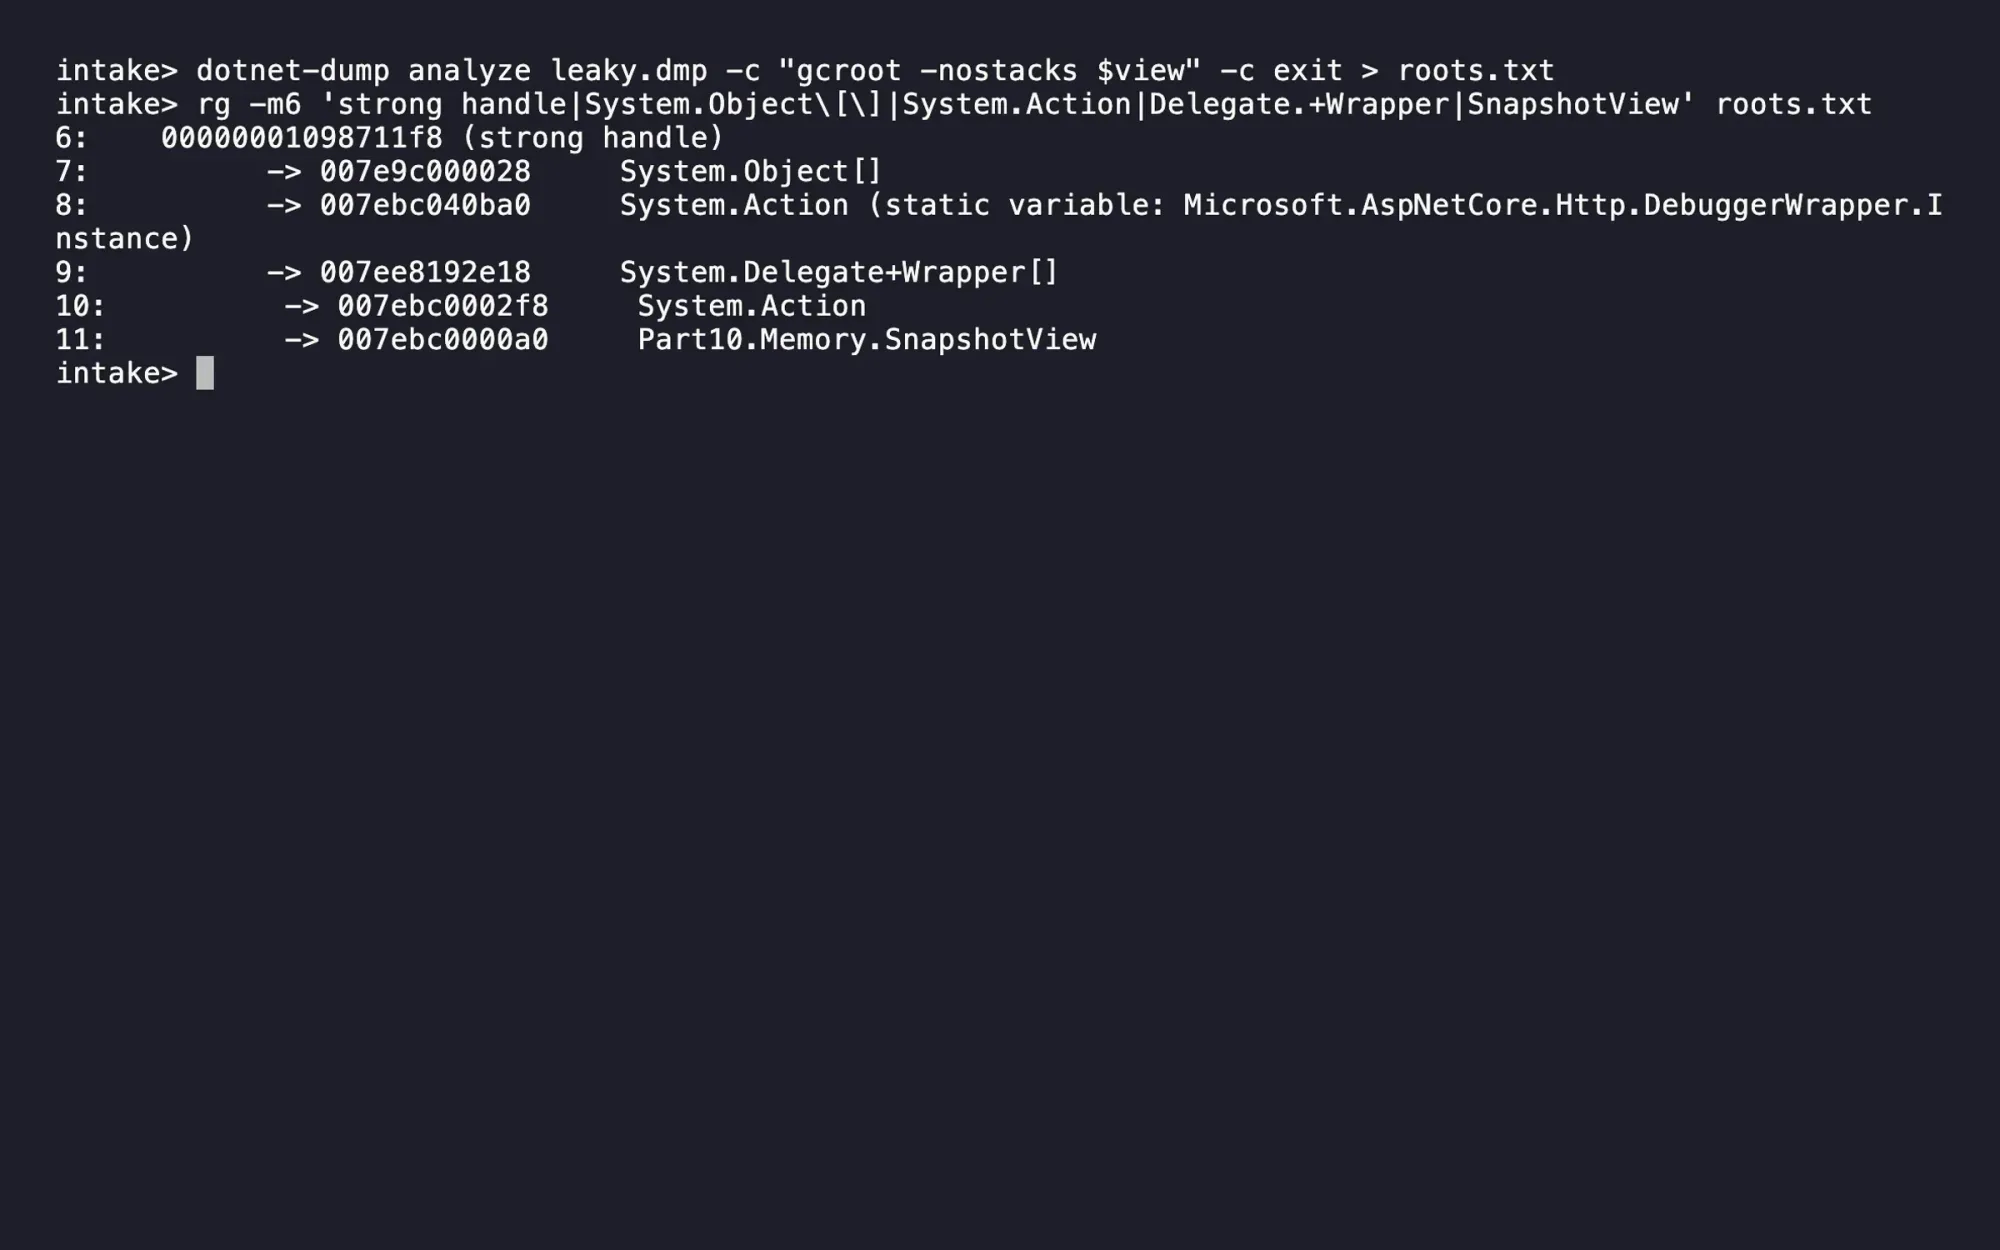
The shape of the chain fits Lena’s source. The parent delegate holds a System.Delegate+Wrapper[] invocation list. An action in that list points to the view whose invalidation method was subscribed. Yet SOS labelled the static edge Microsoft.AspNetCore.Http.DebuggerWrapper.Instance. There is no such field in Intake’s journal. Is the framework really keeping every view?
Test the label against the value in the slot. The path reaches action 0x791ec41618. Which field actually stores that action? These are the two slot rows from the independent inspection of the reference dump.
Slot 78fec013a0 (plus one pointer): Part10.Memory.JobJournal.Changed; type System.Action; referenced object 791ec41618
Slot 78fec01398 (SOS offset): Microsoft.AspNetCore.Http.DebuggerWrapper.Instance; type Microsoft.AspNetCore.Http.DebuggerWrapper; referenced object 794ac32998
DebuggerWrapper.Instance points elsewhere. One 64-bit pointer farther on, JobJournal.Changed contains the action in the chain. ClrMD reports a reference offset with a pointer-sized adjustment. The SOS label lookup used the neighboring slot in this dump. The matching address and the detachment control both point Lena to the event subscription. The earlier course dump was unavailable for this check. SOS static-field annotation.
In Visual Studio, compare the two Windows GC graphs and expand Paths To Root on the growing type. Which part of the Mac chain can you recognize here?
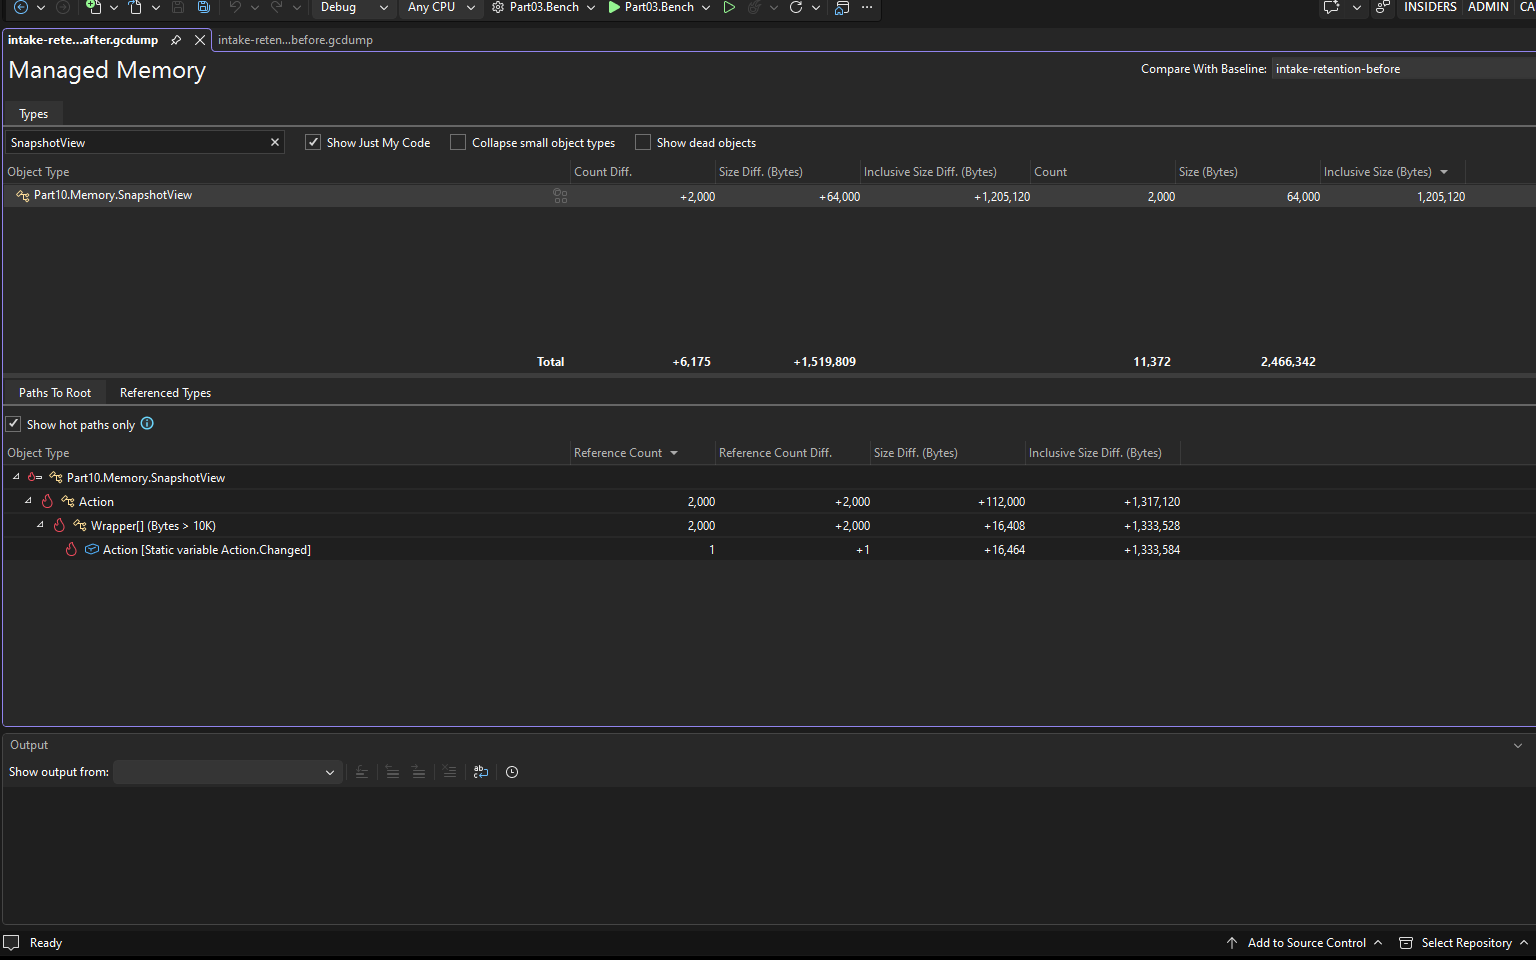
Visual Studio labels the Windows path Changed. On the Mac, Rider groups similar retention paths from a separate run. Follow the group to the static reference and check whether that view names the declaring field.
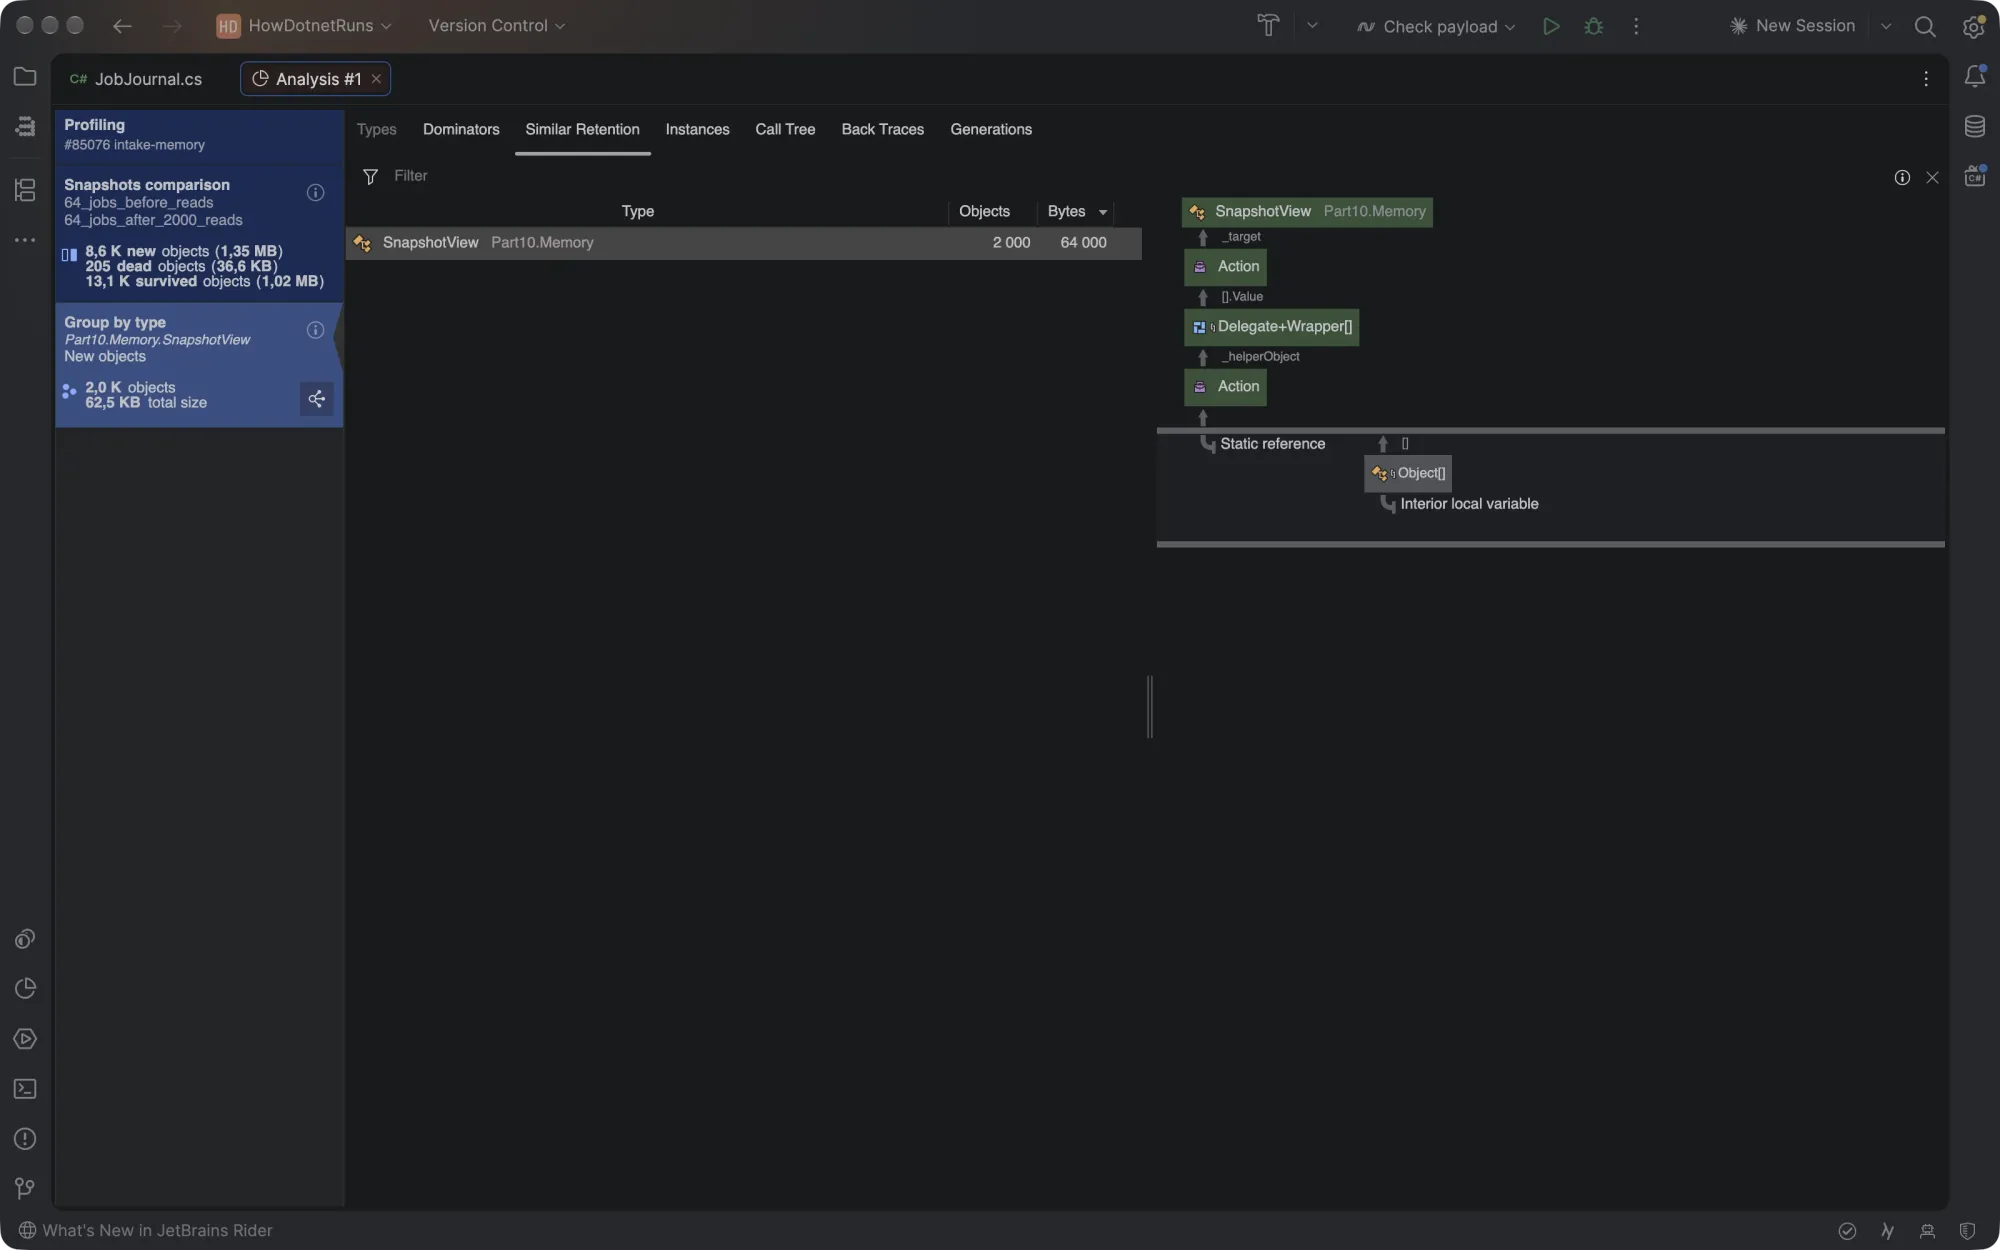
There is a similar trap in the snapshot report. Its first numeric column, Object Bytes, is the graph’s representative size for that type entry. The tool gets the count separately. In the original course replay one array row read 24 bytes and 2,002 arrays. The aggregate dump statistic for that shape was over one million bytes. In this Intake variant the exact array row had 2,000 instances and dumpheap -stat reported 1,072,000 total bytes. Multiplying that size by the count works only when every object in the row has the same size. Ask for the aggregate when aggregate bytes are the decision. Implementation of the report columns.
Release the view after its response and the job after its acknowledgement
There is a useful difference between a view and a job even when both are reachable. The operations dashboard can throw away a view when its response completes. A job whose partner export failed must remain available for retry. The same “objects still alive” diagnosis leads to two different fixes.
A view subscribes without an end to its lifetime
JobJournal.Changed += Invalidate;The static delegate can still deliver an invalidation to a view whose caller has gone away.
Give the subscription a response lifetime
context.Response.OnCompleted(() => { view.Dispose(); return Task.CompletedTask; });
// In SnapshotView.Dispose:
JobJournal.Changed -= Invalidate;
The response-complete callback releases the subscription. The handler also calls Dispose if writing the response throws.
For jobs, write the release condition into the service instead. In a fresh journal with 128 jobs, a malformed acknowledgement and a failed partner result both leave all 128 present. Successful acknowledgements remove exactly jobs 65 through 128. Repeating the success for 65 leaves the remaining originals intact. How does the journal distinguish completion, a retry and an unknown job?
A failed acknowledgement leaves the journal entry available for retry
context.Response.StatusCode = outcome switch
{
    null => StatusCodes.Status400BadRequest,
    { Error: not null } => StatusCodes.Status409Conflict,
    _ when journal.Acknowledge(id) => StatusCodes.Status204NoContent,
    _ => StatusCodes.Status404NotFound
};

public bool Acknowledge(int id)
{
    bool removed;
    lock (jobs)
    {
        if (id < 1 || id > lastIssued) return false;
        removed = jobs.Remove(id);
    }
    if (removed) Changed?.Invoke();
    return true;
}- A missing outcome or partner error selects a response before the handler can remove any job.
- Only the success branch calls Acknowledge with the id of the partner export that completed.
- The journal checks the issued range and removes by id under the same lock that protects append and snapshot.
- A repeated success for a previously acknowledged id removes nothing else. The drain control verifies the 64 original jobs individually.
Excerpts from src/Part10.Memory/Program.cs and JobJournal.cs. Request parsing and the route wrapper are omitted. Actual 64-to-128-to-64 survivor rows are in results/mac/part10/jit-drain.json.
The final full-collection snapshot contains exactly 64 QueuedJob objects again. The HTTP control also compares every remaining ID and name against the original seed. The heap count catches retention of completed jobs. Comparing the contents also catches deletion of the wrong pending job. If a cache intentionally holds a view after its response, write down its eviction condition and exercise it instead. Following the reference that still owns a payload.
Which receiver can show what holds the view?
Dana needs a path to one live SnapshotView. She found it on ordinary macOS and Windows builds. Microsoft also documents dotnet-dump on Linux. The matrix distinguishes a documented tool from a root path actually observed here. dotnet-dump collection and analysis.
What survives the switch to Native AOT on the same receiver? A counter, a heap total and a reference chain provide successively more specific evidence. Watch where the tools stop on the native Mac. Microsoft’s Native AOT heap-analysis guidance.
The clip repeats the Mac test. In the table, each native pair is the reported heap size after seeding 64 jobs and after 2,000 reads. All four emitted System.Runtime counters and zero type rows in the GC reports. Read the JIT column for the separate ownership question.
| Receiver | Ordinary JIT: owner found? | Native GC heap, seed → after (B) | Native managed-dump result |
|---|---|---|---|
| macOS Arm64 · Apple M3 Max | Confirmed. SOS traced the delegate list to a live view. The independent static-slot read identified JobJournal.Changed. | 2,711,484 → 4,170,870 | Heap dump write failed. |
| Windows x64 · AMD EPYC | Confirmed. The ordinary dump contained the delegate chain. Visual Studio’s two-snapshot comparison also showed +2,000 views and a path to Changed. | 2,802,335 → 4,259,553 | Wrote a file. Managed analysis reported “No CLR runtime found.” |
| Linux x64 · AMD EPYC, WSL2 | The ordinary process maps were measured. A managed root path for this view was not collected. | 2,500,488 → 3,969,434 | Heap dump write failed. |
| Linux Arm64 · Apple Silicon VM | Native capability check only. No ordinary owner was investigated on this receiver. | 2,500,420 → 3,960,870 | Heap dump write failed. |
/observations supplies a useful lead even on the native releases. All four services reported 64 jobs and 2,000 subscriptions after the reads. Those are counts from the application’s journal and event list. A managed root graph lets an investigator select a survivor and follow its incoming references. None of the native tool runs identified an owner. On the Mac even an explicit EventSourceSupport=true, already the Web SDK default for this publish, left the type table empty.
What should the Windows on-call engineer do next?
Take the late shift on a Windows x64 service published as Native AOT for .NET 11. After a dashboard refresh storm the jobs are still present, new subscriptions keep accumulating and the native dump writer returned success. You can deploy an ordinary sibling for investigation. Would another dump from the native process answer your ownership question, or do you need to replay the requests in that sibling? The last two stages use separate fresh JIT processes, first with the subscription and then with the detachment fix.
A written native dump still leaves one question for the ordinary Windows build
- The native application reported 64 jobs and 2,000 subscribers after the reads. Record the stop and the build before asking what objects still exist.
- The native GC graph reported totals. The managed heap command could not open a CLR in the written native dump. A larger totals-only capture cannot name a view.
- Repeat the input on the ordinary Windows build. Select one of the 2,000 surviving views and follow its delegates to the static subscription.
- The separate detached JIT process kept the same 64 jobs and lost the exact view row. Qualify the same corrected path on the native candidate before shipping.
Windows x64 on AMD EPYC. The three journal runs each used 64 jobs and 2,000 reads. The native managed-analysis message comes from a separate dump collected after 64 verified posts.
Assign the incident to the owner of the response handler. Record the edge to break. After the final response, JobJournal.Changed still reaches the completed SnapshotView. Attach the ordinary root report and state which reads still need a release-candidate check. A Linux-only team would first have to qualify its ordinary root-path workflow there.
Record the tool version and the point where memory was read. On the new Mac dump, dotnet-dump 9.0.661903 rejected the CLR debugging-layer version. Version 10.0.750501 opened it. The subscribing process had 101,269,504 resident bytes after the reads and 408,944,640 after the heap-dump operation. The latter observation includes the diagnostic intervention.
A Mac operator can still open vmmap when the managed report stops at totals. In the two new idle listeners below, follow the named images and the physical-footprint field. A shared library’s resident pages can appear in several process maps.
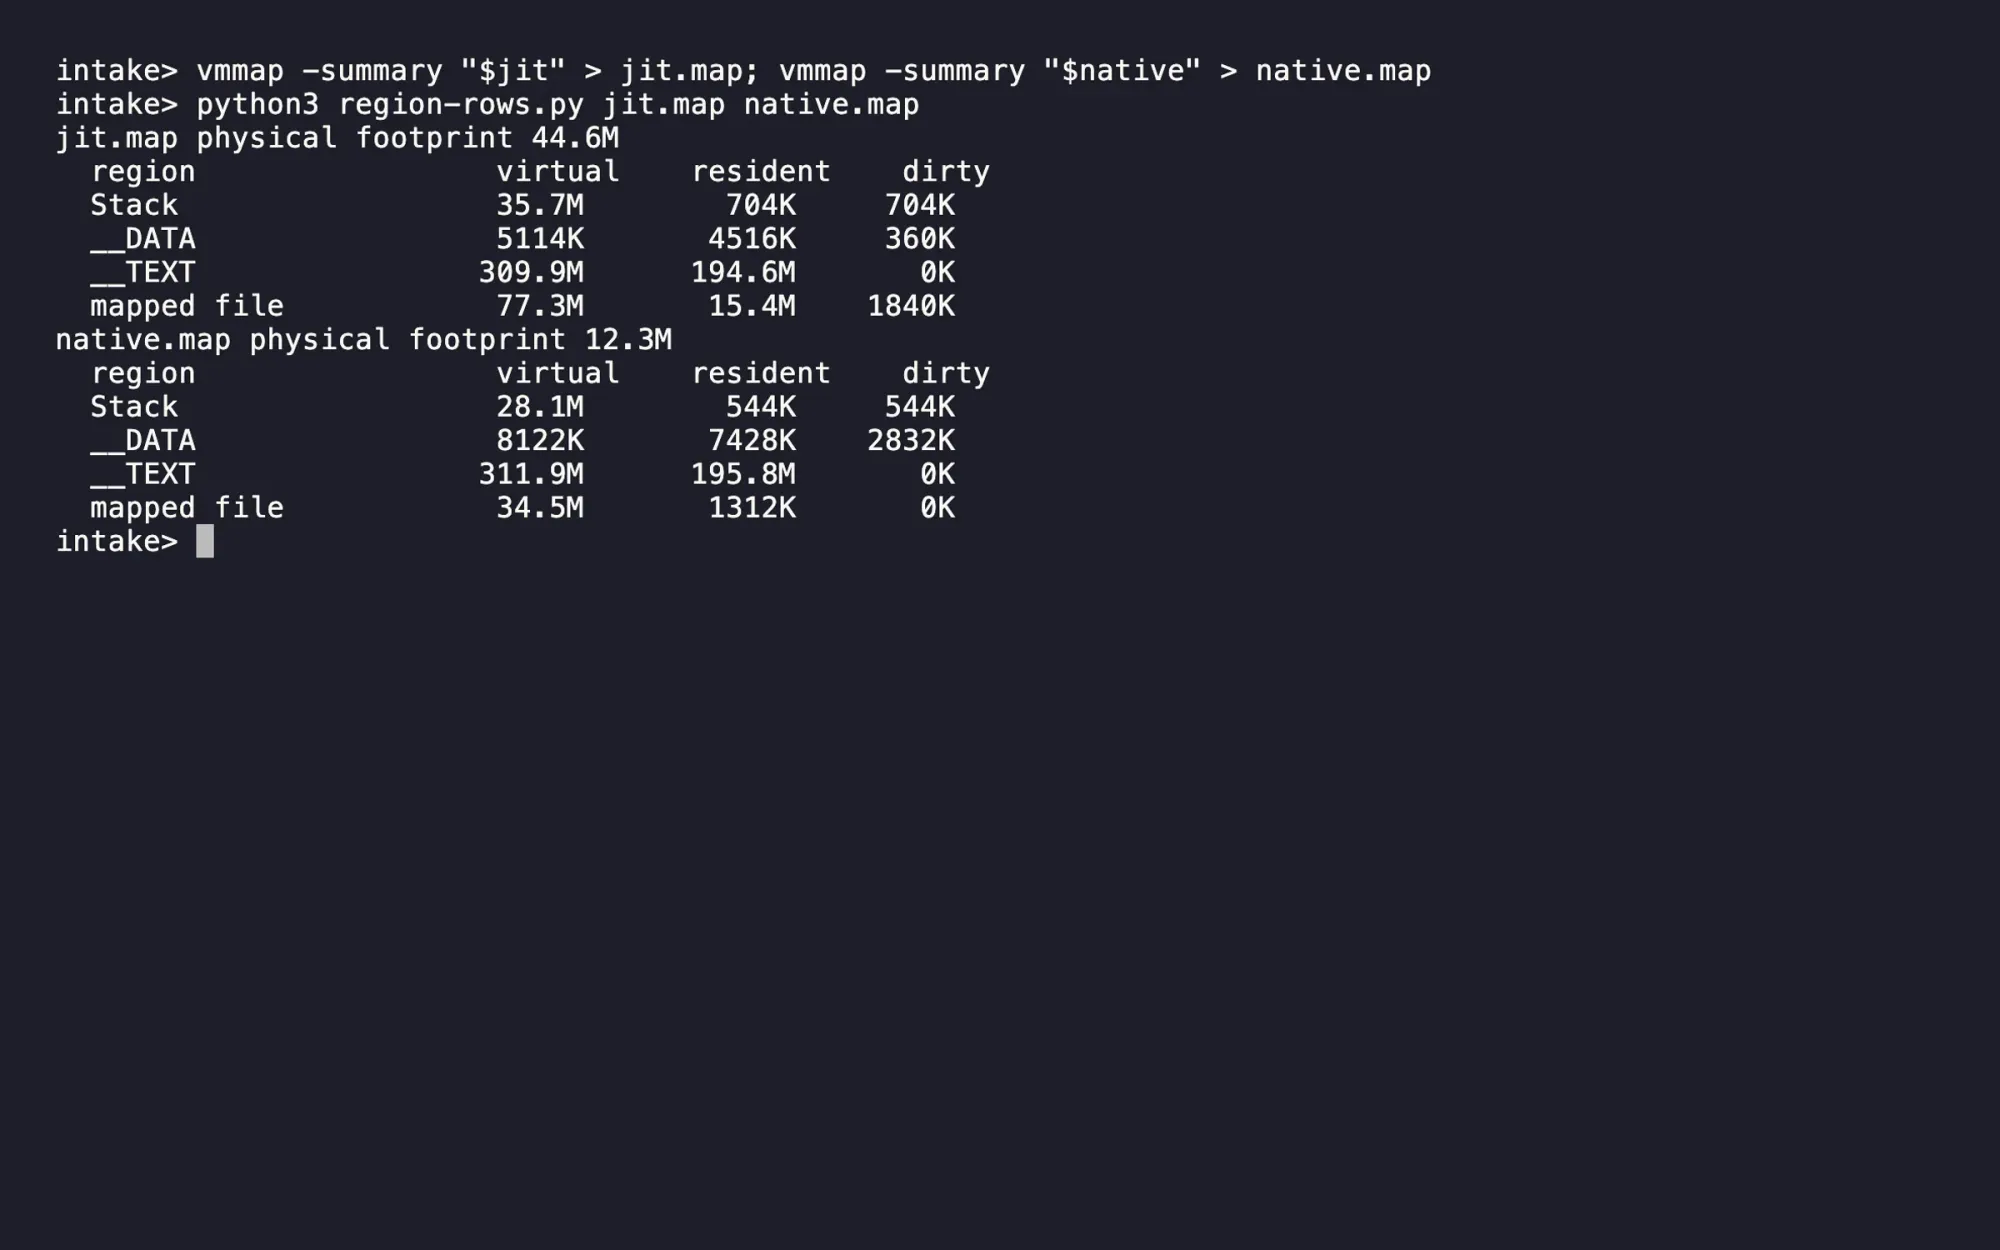
A worker stopped after 64 exports cannot price a production node
Ravi sends 64 named jobs into a network-isolated Linux x64 container with a 512 MiB limit. For each acknowledgement, a parser opens the partner XML and verifies the name. Standard input stays open. What memory use does Docker report while the worker waits?
With two CPUs, Docker displayed 13.41 MiB for the ordinary worker, 12.98 MiB for ReadyToRun and 8.859 MiB for Native AOT. All three used the bounded XML writer. The capture repeats the native case. The download also records the cgroup’s memory.current, which uses different accounting.
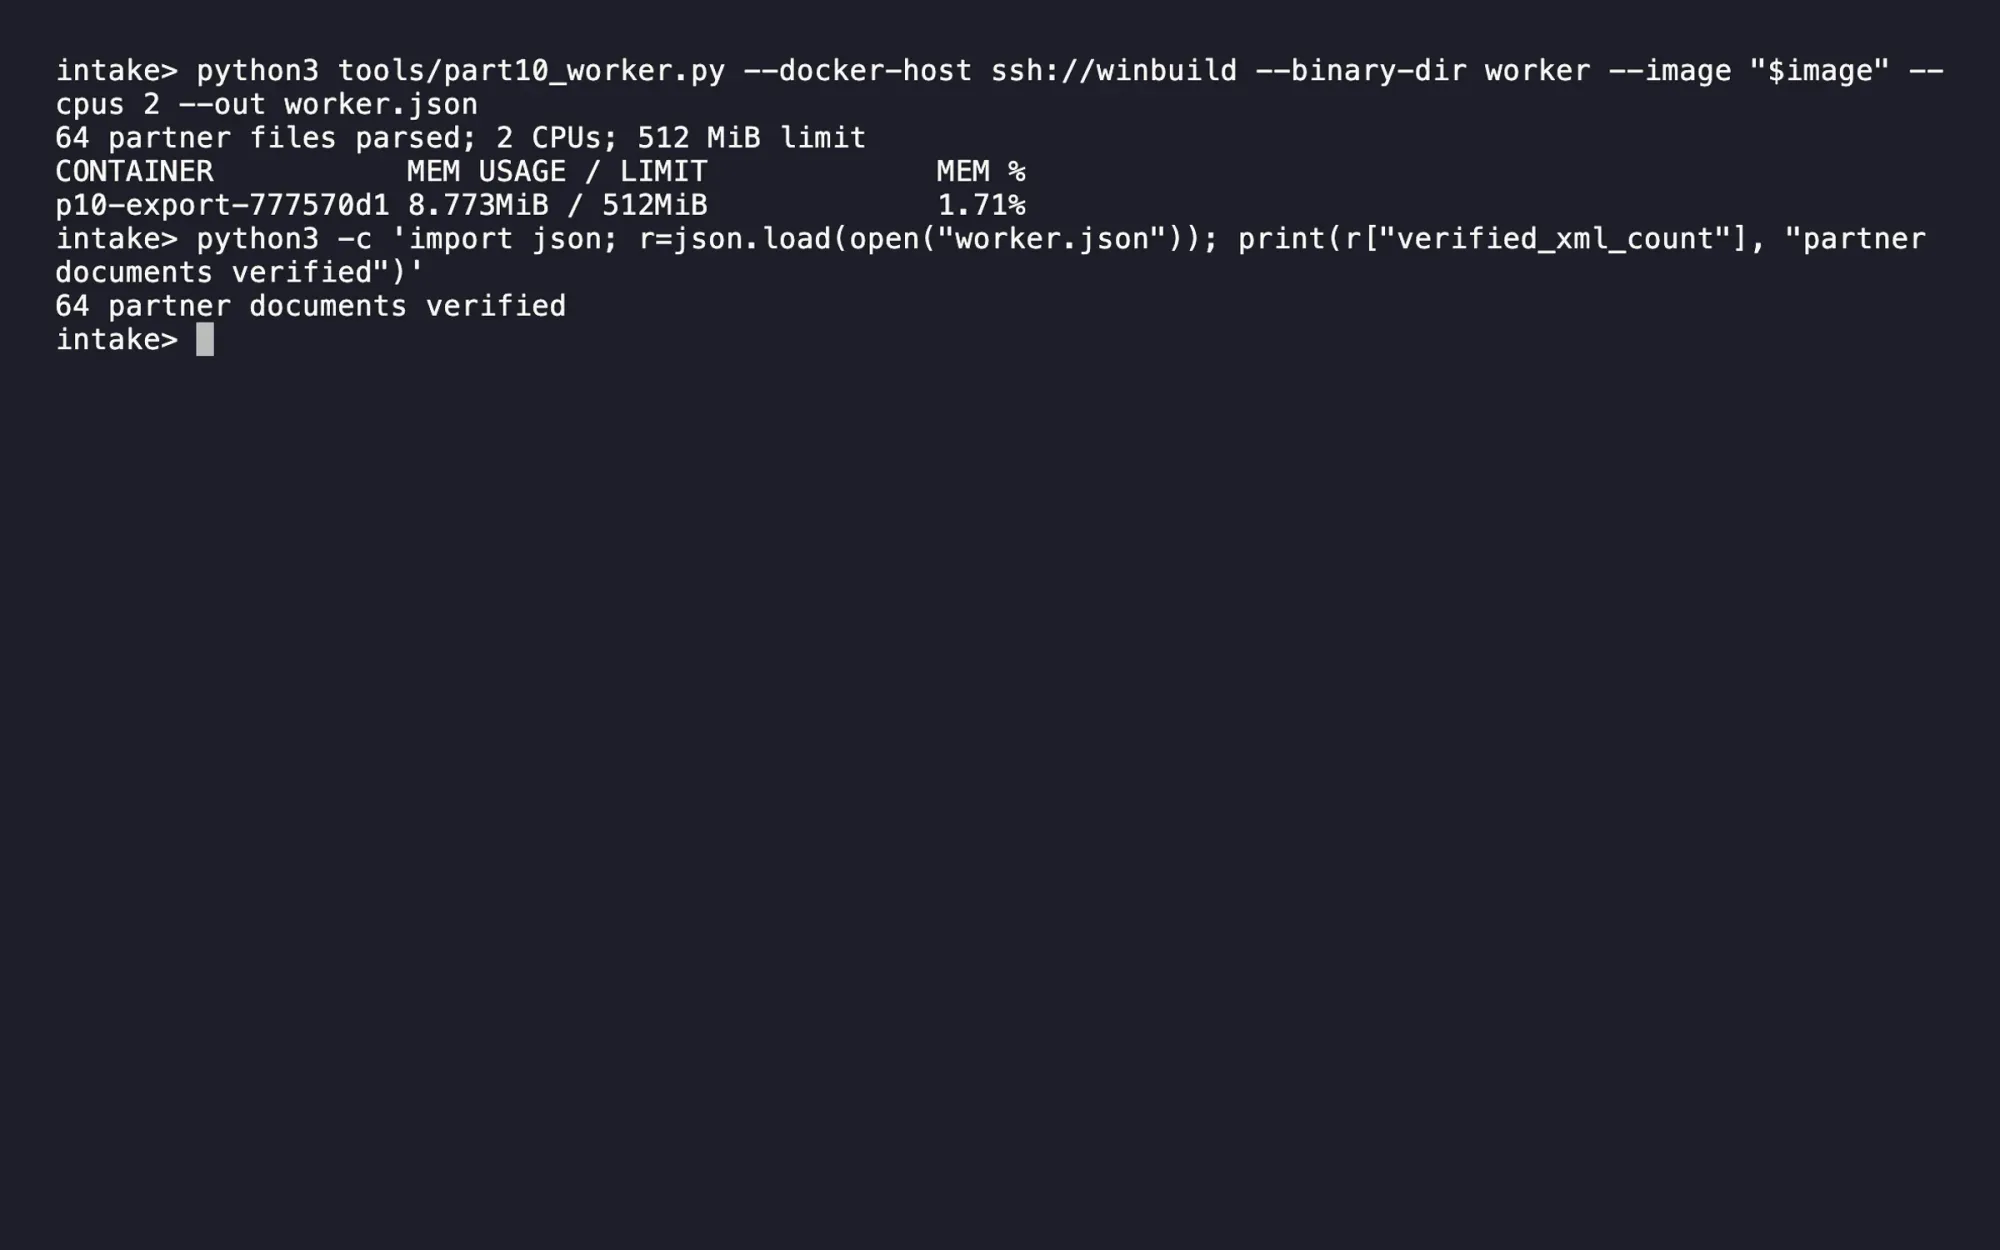
The waiting worker tells Dana little about the space a busy instance needs for batches and buffers. What would justify a runtime upgrade for the exporter?
Which wait would a runtime upgrade change?
Suppose the partner reports a late batch even though the worker logs accepted for every job. Would switching runtimes help? Dana compares the ordinary, framework-dependent workers on .NET 10.0.15 and 11.0.0. Both use the same XML writer. A job counts only after the worker replies accepted, the client reopens the final path and an XML parser recovers the exact submitted name. In the Windows correctness check, both versions produced the same 61 bytes for 2.xml, including the escaped form of R&D <night> Łódź #000002.
On an Apple M3 Max, Lena ran the same compiled PartnerExport.Write against a prepared in-memory writer. Writing R&D <night> Łódź allocated 13,696 B on the calling thread in both runtimes. Prefixing 1,000 x characters and a slash raised both to 16,800 B. The real worker also writes a file that the partner reopens.
Dana alternates .NET 10 and 11 on the same Windows Server 2022 host with an AMD EPYC 7502P. Each worker warms up on 32 verified files and stays alive for 1,000 more. One job is outstanding at a time. Its clock starts when the client sends the job and ends after acknowledgement and XML readback. Divide the worker’s increase in user plus kernel CPU time by those 1,000 verified files to get CPU milliseconds per file.
All six pairs completed, three in each version order. Read the ends of each line together. In the top panel each endpoint is a process’s 99th-percentile file wait (p99). Each diamond is the median of the six endpoints on that side. If a worker spends less CPU per correct file, does the partner also receive files sooner?

CPU per file fell in five pairs and was unchanged in one. The median paired saving was 0.078 ms per file. Throughput moved both ways, from 6.4% lower to 8.1% higher on .NET 11. The median ratio of .NET 11 p99 to .NET 10 p99 was 1.147 in the three pairs starting with .NET 10 and 0.737 in the three starting with .NET 11. At the closing checkpoint, median working set rose from 40.80 to 41.95 MiB. This is resident process memory, which includes code and buffered data as well as the managed heap.
The workstation stayed shared with Docker and WSL. Across the 12 timed processes, the two one-second host samples per process put mean physical-disk traffic between 6.70 and 82.70 MiB/s. Those readings include the worker’s own writes. They cannot identify what delayed one particular file.
Did GC stop the worker long enough to explain a late file? Dana replays the jobs with a diagnostic hook in six fresh processes per runtime. Each window opens after warm-up and closes after 1,000 checked files. The hook subtracts the two GC.GetTotalPauseDuration() readings for that process. Read the pause share against the combined wall time of those six windows.
| Runtime | Total GC pause | Share of time | Collections (gen 0 / 1 / 2) |
|---|---|---|---|
| .NET 10.0.15 | 17.464 ms | 0.37% | 12 / 6 / 0 |
| .NET 11.0.0 | 18.668 ms | 0.41% | 12 / 6 / 0 |
A collection in a higher generation also increments the lower-generation counters. Both builds spent under half a percent of the diagnostic window paused, but those totals carry no timestamp for an individual pause and no pause p99. To investigate a late file, trace its temporary write, rename and client reopen. A GC suspension overlapping that wait would support a GC explanation. A delay in a file operation while managed execution continues points to the storage path.
Dana keeps .NET 10 for this throughput-led rollout. None of the six pairs reached the required 10% gain in correct files per second. To reopen the decision, repeat the paired test on the partner’s storage with its actual batch sizes and latency budget. The ZIP includes the raw file observations and the paired report under results/migration/.
Try the diagnosis on a search index refresh
Consider a search service that keeps the latest index for each tenant. During a refresh it builds a new generation. Queries already in flight may finish on the old one. Allocated bytes rise during the rebuild and RSS stays high after the swap. Before proposing buffer pooling or a larger container, choose a stopping point, identify the object that should disappear, and predict what would send you looking for its owner.
Check your diagnosis
Verify a query against the new generation and let the last reader of the old generation finish. At that stop the current index is supposed to survive. A count of live index objects can hide which tenant or generation they belong to. Compare the retired generation IDs at that same stop after successive refreshes. A compacting GC can move a surviving object, so identify the index by tenant and generation. How garbage collection relocates survivors.
If an obsolete generation survives, follow one incoming path. A lease still held by a reader calls for a different fix from a cache entry left behind after the swap. Change the suspected owner’s release rule, then repeat the same refresh and query. If the old generation disappears but allocation volume remains high, inspect allocation stacks during construction. If the remaining concern is resident memory, compare OS mappings at the same stop.
Choose the observation before starting the collector
Open src/Part10.Memory for the isolated API or run the functional verification from the extracted solution. Install the pinned SDK, Python and the native prerequisites for your target. To repeat the heap investigation, also install dotnet-gcdump, dotnet-counters and dotnet-dump 10.0.750501. The fixed-work memory harness builds the candidate for the current host, then runs the two subscription policies in separate processes. Give it a fresh result directory and the directory where the three diagnostic tools are installed.
python3 bench/harness/memory.py --mode jit --cases leaky detached \
  --tools my-tools --reads 2000 --out my-results
The driver launches a disposable local process, bounds its lifetime, verifies the input and records full text reports. It only targets the process it started. The optional offline slot inspector needs the same private dump as the original root report and the matching ClrMD assembly. The companion lesson 06 follows the original case on one Mac. The release comparison here adds OS maps, the verified static slot, acknowledgement and drain controls, native diagnostics on Windows and both Linux architectures, and the container accounting. What a performance diagnostic should deliver.
- Name the memory quantity, the unit and the exact operation after which you read it.
- Keep runtime, publish mode, CPU availability, GC flavor and memory limit with the measurement.
- Compare an exact survivor row after equivalent work, then inspect the root of an object from that row.
- Test the product rule that ends ownership. A failing export must preserve a job and a completed read should release its view.
- Check what each production diagnostic tool can collect and interpret. Qualify density only with a representative steady workload.
Further reading
- Collecting managed heap graphs and considering the induced collection. dotnet-gcdump.
- Choosing server or workstation collection and setting heap limits. Runtime GC configuration.
- Adapting server collection to long-lived memory. DATAS.
- Native image diagnostics and their limitations. Native AOT diagnostics.
- Reading cumulative process-wide managed pause time. GC.GetTotalPauseDuration.
- The tool version’s exact reporting and root annotation implementations. Snapshot columns and SOS root annotation.
Intake’s release memo now names a reproducible lifetime rule, a starting footprint on each tested receiver and the actual diagnostic tools available. The static subscription holds the request-view design until the view is detached. A native worker’s bounded footprint earns a target-specific follow-up, with steady density still open.
Dana has four deployables, several candidate files and a different body of evidence for each. Which row can she sign today, which must she hold, and what observation would make her reverse either decision?
How .NET Runs Your Code, part 10 of 11. Previous, How to Compare .NET JIT and Native AOT by CPU per Completed Job. Next, JIT, ReadyToRun or Native AOT? Four .NET Release Decisions.