

Consider a company portal written in Blazor that gets three AI features in one quarter: an assistant that streams answers about the travel policy, a semantic search box over the help centre, and live suggestions in the parts catalogue. Within a month three tickets arrive. An answer about hotel limits in Germany quotes last year's amount under this year's policy, although every request succeeded. A field engineer on a train reports that the help page "took forever" the first time. And the database log shows a query for the single letter c every time someone types cat, while the screen sometimes shows the suggestions for c under the word cat.
None of the three is a bug in the model. Each is about where the component's work runs and what crosses the network on its behalf: the circuit that carries every server render, the megabytes downloaded before the first embedding, the requests a search box abandons on every keystroke. Three deep dives built these features on .NET 11 and measured them. This guide draws the map that connects them, puts their numbers side by side and points to the one that answers your question.
- Choose where the work runs before you choose a pattern. On Interactive Server every render is a batch over the circuit: rendering per chunk sent 78 batches per streamed answer, a 50 ms throttle 28. On WebAssembly the model key cannot ship, so streaming goes through your own endpoint.
- Streaming turns every
awaitinto a way back in for old work. In 80 simulated sessions where the user asked twice, a naive handler showed text or a status from the wrong question in 52; a handler that checks ownership after every await in none. - Client-side semantic search moves the cost rather than removing it: 40.6 MB on the first visit with the int8 model (108.0 MB with float32), then 14.6 ms per query at p50 in the browser against 11.2 ms through an endpoint on loopback.
- A component makes requests nobody sees. Debounce, cancellation and a generation number each stop a different layer of that work; typing "cable tester", only debounce took 12 requests to 2, and only an endpoint that honors
RequestAbortedstopped abandoned queries on the server.
Where the work runs: one component, two places
A Razor component does not say where it runs; its render mode does. The render modes documentation lists four: Static Server (rendered once on the server, not interactive), Interactive Server ("interactive SSR using Blazor Server", rendered on the server), Interactive WebAssembly (rendered on the client), and Interactive Auto, which starts on the server and uses WebAssembly "on subsequent visits after the Blazor bundle is downloaded". Prerendering is on by default for all three interactive modes. For an AI feature the choice decides three things at once: where the code that calls the model runs, what a render costs, and what the browser has to download first. Where does each piece of an AI feature run?
On the server every render crosses the circuit; in the browser the key stays behind and the model can move in
- Three places run code: the browser, your server and the model provider. A component with Interactive Server rendering lives on the server; with Interactive WebAssembly it lives in the browser. Interactive Auto decides once per component, starting on the server.
- On Interactive Server the browser holds only the DOM. A click, and every
@oninputkeystroke, travels as a message over the circuit's WebSocket to the component on the server. - The component calls the model through
IChatClient, and the provider streams chunks back to the server. Withgpt-5.4-minithe first text left the provider 620 ms after the request at the median. - Each
StateHasChangedrenders, diffs and serializes on the server and sends one render batch down the circuit. Rendering per chunk sent 78 batches per answer; a 50 ms throttle sent 28. - On WebAssembly the component runs in the browser, but the API key must not, so it streams the answer from your own endpoint. Since .NET 10, browser
HttpClientresponses stream by default. - For semantic search the model itself can move: the browser downloads 40.6 MB once (int8), and a worker embeds each question in 11.7 ms at p50 without any request.
Numbers from the streaming deep dive (Blazor Web App, Interactive Server, simulated model and a live gpt-5.4-mini run) and the semantic search deep dive (Blazor WebAssembly, headless Chrome 157), both on .NET 11.0.0 and loopback. The WebAssembly streaming path is the documented .NET 10 default, not a measurement.
Interactive Server keeps the key, the model call and the component together, and pays with the network on every render and input event. WebAssembly keeps renders local, but the model call still needs a server hop, and anything you ship belongs to every visitor. Interactive Auto gives you both, one after the other, and "never dynamically changes the render mode of a component already on the page", so the same component must work correctly in both places.
On Interactive Server, every render is a network message
On the server render mode, StateHasChanged is not a cheap repaint. The streaming deep dive read the path in the ASP.NET Core source: the renderer builds the tree, diffs it, and in RemoteRenderer.UpdateDisplayAsync writes the batch to a byte buffer synchronously, then hands it to SignalR without waiting. The browser applies the diff and acknowledges the batch id. With 10 batches unacknowledged (CircuitOptions.MaxBufferedUnacknowledgedRenderBatches) the renderer stops producing batches until an acknowledgement arrives.
The component pays for each render on the circuit's dispatcher before it can process the next chunk: 71 µs per StateHasChanged at the median. The built-in metric is easy to misread: aspnetcore.components.render_diff.duration reported 1.26 ms for the same renders, because on Server it stops only at the browser's acknowledgement.
ComponentBase renders an event handler only when it first yields and when it finishes, so streamed text needs explicit renders. Rendering per chunk turned a 73-chunk answer into 78 batches and 35.3 KB on the wire. A throttle that renders the first chunk of a 50 ms window at once and schedules one trailing render for its end sent 28 batches and 12.6 KB. The trailing render matters: a throttle that only skips renders leaves the last chunk off the screen until the next one arrives, which for a pausing reasoning model can be seconds.
The price is paid by chunks in the middle of the stream: 24.4 ms later at the median, at most 50.6 ms, against 0.4 ms when rendering per chunk. The first and last chunks still appeared at once, so the finished answer was on screen at the same moment in both policies (2,327 and 2,328 ms after the click at p50). A slow circuit notices the chunk rate more than a reader notices 24 ms: by the deep dive's arithmetic, rendering per chunk fills the 10-batch buffer once the round trip exceeds about 190 ms.
Input crosses the circuit too: in Server mode every @oninput event is a message to the server and a render diff back, before your own HttpClient call starts.
Streaming turns every await into a way back in
Blazor runs one piece of component code at a time, but the synchronization context documentation says a component is re-entrant wherever it awaits an incomplete task. A streamed answer is a loop of such awaits: each chunk, the end of the stream, a validation step, each catch and the finally may resume after the user has asked something else.
The naive handler in the streaming deep dive had three bugs and no race condition: an old chunk appended to the new text, an old finally clearing the busy flag mid-answer, and an old verdict labelling the new correct answer "The answer failed the check". Each was an ordinary write by a continuation whose assumptions had expired.
How often does a user meet that? The deep dive replayed the opening scene in headless Chrome 80 times per variant with seeded random latency: ask about the 2025 policy, wait 100 to 3,000 ms, switch to 2026 and ask again. Whenever the first answer had not finished on screen at the second question, the naive handler got the view wrong: 52 of 52 such trials. In 47 of them the old stream's words landed inside the new answer; 2,043 old chunks arrived after the second question, and every one was appended. The guarded panel had the same timing in 53 trials and showed nothing wrong in any of them.
The fix is one rule with three names on this site. The streaming panel calls it a revision, the search box a generation, the semantic search component a ticket: a number taken before the first await, and checked immediately before every write that follows one. The streaming version adds a CancellationTokenSource per request, takes ownership before cancelling the previous request (because a cancelled task can resume inline, inside Cancel()), and clears the busy handle only if it still points at its own request. Stop and disposal advance the revision too, so late output belongs to nobody whatever the provider does with the token.
The ownership check must sit directly before the write it protects, with no incomplete await in between. A check, then an await, then a write protects nothing: the await is exactly where the next event gets in.
Streaming also forces product decisions. Stop, for a read-only answer, means the user no longer wants this output, so late text is dropped even from a provider that ignores the token. Half an answer from a failed model stays on screen, marked incomplete, with the failure in a polite live region. A provider timeout surfaces as TaskCanceledException, so only cancellation of your own token counts as Stopped. None of this refunds generated tokens or undoes a tool call: an assistant that can act needs an operation id the server understands.
What a live model changed
The simulated model in those runs was chosen to look like a hosted one, not measured from one. The upgraded deep dive also ran the guarded panel against gpt-5.4-mini with low reasoning effort: 10 answers, all complete, all passing the check. Most of the wait was the model: the first text left the provider 620 ms after the request at the median and 896 ms at p95, and the reader saw it 666 ms after the click (941 ms at p95). Half of the gaps between chunks were under 1 ms (0.2 ms at p50, 19 ms at p95), so a real stream arrives in bursts, several chunks per network read. The throttle turned 43 text chunks into 10 render batches, 3.9 KB per answer.
The live run also found a bug the simulation could not: every answer began with a role-only update without text, which took the window's immediate render, so the first words waited 46.4 ms at the median for the trailing render. The panel now skips updates without text. The provider's wire format reaches your render policy; measure against the real provider at least once.
What moves to the client in semantic search
Semantic search can leave the server entirely. The deep dive ran all-MiniLM-L6-v2 with ONNX Runtime Web in a Web Worker behind a Blazor WebAssembly component, and the same model file on ONNX Runtime for .NET behind an endpoint. Four things moved.
The download. A first visit with the int8 model received 40.6 MB in 58 requests; with the float32 model 108.0 MB. The weights were 23.0 MB and 90.4 MB of that, against 2.6 MB of Brotli-compressed Blazor framework and 14.9 MB of ONNX Runtime Web. Weights barely compress: the int8 file kept 74 percent of its size under gzip. On loopback the search box was usable 1,446 ms after navigation at p50, against 628 ms for the same page in server mode, and on a real link the bytes come back: at 20 Mbit/s the int8 model alone takes about 9 seconds by the article's own arithmetic. With the model in Cache Storage, a second visit sent no body bytes and was ready in 1,213 ms: cached bytes are not a warm session.
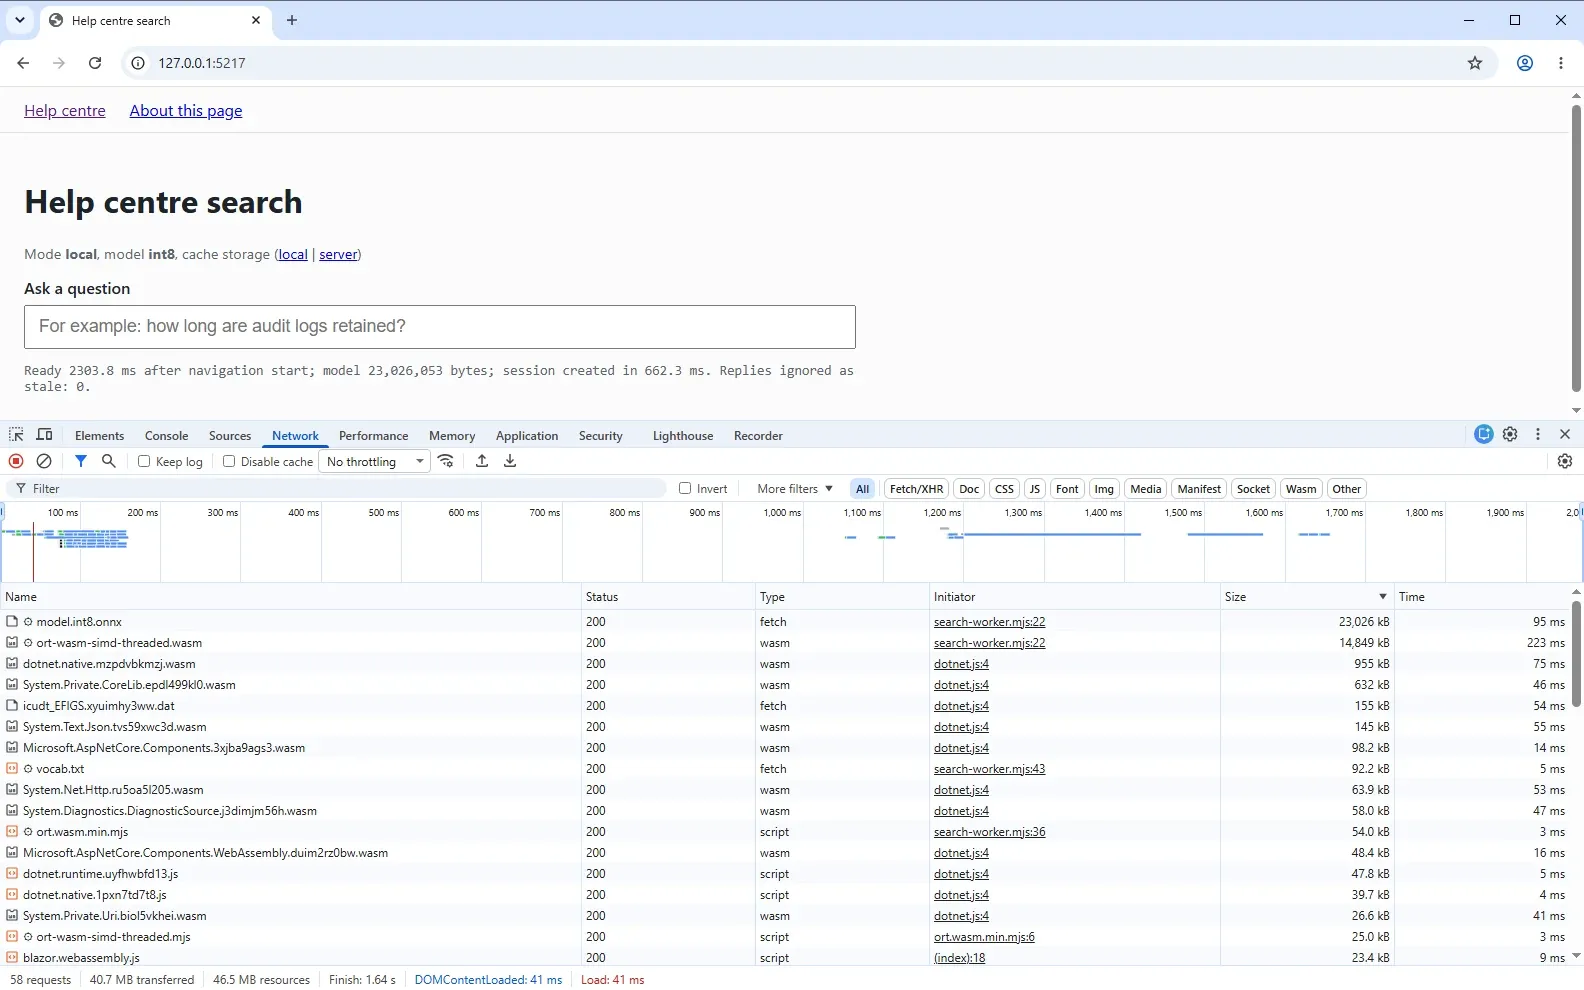
The latency. Once warm, the browser was close to the server: 14.6 ms from the input event to rendered hits at p50 locally, against 11.2 ms through the endpoint on loopback. Native inference on the server was about twice as fast (5.2 against 11.7 ms), and loopback added almost nothing. A real network flips the comparison: a 30 ms round trip is more than the whole local query. The server's advantage is the network the benchmark did not have; the browser's is the network it never uses.
The CPU and the lifecycle. The work now runs on the reader's machine, and it must not run on the main thread, where Blazor WebAssembly renders and handles input. The worker owns the session; a small bridge keeps one query in flight and one waiting, and replaces the waiting one on each keystroke. Typing a 37-character question with no delay between keys produced 37 input events and 6 to 8 inferences; at 80 ms per key the worker kept up with 35.
The data and the model's details. Everything shipped is readable by the visitor, the documents and their vectors included, so local search suits only documents every visitor may read in full. Tokenization and pooling are part of the model: the server's .NET tokenizer disagreed with the reference ids on tabs and line breaks until a test caught it, and the int8 model produced slightly different vectors on ONNX Runtime and ONNX Runtime Web (lowest cosine 0.9873 between the two runtimes, where float32 agreed to the seventh decimal). The small model limits quality more than the platform does: int8 put the answering paragraph first for 19 of 20 questions, float32 for 18, and both ranked two-factor above single sign-on for "Can I still sign in with my password after SSO is enabled?". Show ranked evidence with scores, not one answer.
If you later synthesize an answer from those hits, the problem becomes retrieval with rules (which passages the caller may use, which revision is in force, whether the numbers match the source), the subject of the RAG series linked below.
The requests a component makes that nobody sees
A search box bound to @oninput looks like one component doing one thing. On the wire it is a stream of overlapping requests, each with its own response, failure and cleanup. In the deep dive's naive version, typing cat about 85 ms per key started three requests; the one-letter prefix was the most expensive query (simulated at 600 ms, against 300 and 100 ms), so the responses came back in reverse order and the screen ended on the suggestions for c in all 8 runs. When the oldest request answered HTTP 500 instead, the screen showed the ca list next to "Search failed.", a state no single request produced.
Three mechanisms fix it, and each does exactly one job. Debounce decides when work may start. Cancellation asks started work to stop. The generation decides which result, error or spinner change may write the view. Which one stops which part of the hidden work?
Each mechanism stops one layer of hidden work, and none of them stops all of it
- One user action produces work in five layers: what the screen shows, what starts, what crosses the circuit, what the browser keeps open and what the server and the provider keep doing.
- The ownership check fixes the screen and nothing else. With it alone, the search box still sent 12 requests per "cable tester" and the server still spent 1,900 ms on them.
- Debounce and the latest-only queue decide what may start. Debounce cut 12 requests to 2, paid in latency (357 ms instead of 106 ms until the list was right); the queue cut a burst of keystrokes to 6 to 8 inferences.
- On Interactive Server, a render throttle with a trailing render bounds the batches by time instead of by chunk count: 78 to 28 per streamed answer.
- Cancelling the token aborts the browser
fetch, and the server seesRequestAborted. An endpoint that ignores it finishes the query anyway: it kept working 212 ms at p50 after the abort. - Only the endpoint can stop abandoned server work, by passing
RequestAbortedinto every call. A cancelled model stream stops the waiting, not the tokens the provider already generated.
Search numbers: "cable tester", 12 keystrokes, 8 runs per variant, simulated query costs. Streaming numbers: 80 trials per variant and 25 answers per render policy, simulated model. Queue numbers: 5 runs at 0 ms per key. All Blazor on .NET 11.0.0, headless Chrome 157, loopback.
The cheap fixes are the visible ones. The generation check costs nothing and makes the screen right, which is why it is easy to stop there. But an abandoned request holds a connection slot and whatever the real query holds (a database connection, a lock, a downstream call) until it finishes. And debounce is not admission control: a pause after "cable" admitted a request in every measured run.
Two more kinds of hidden work come from Blazor itself. Prerendering is on by default for interactive components, so a component initializes twice: while the server prerenders and again when it becomes interactive. The prerendered state documentation shows OnInitialized executing "a second time". A component that calls a model or an embedding endpoint in OnInitializedAsync therefore makes that call twice per full page load, unless the result is persisted with [PersistentState] (new in .NET 10), the call waits for RendererInfo.IsInteractive, or prerendering is off for that component. Persisted state for WebAssembly and Auto is written into the page, readable by the browser.
The second is disposal. Nothing stops the work a component started unless Dispose cancels it. The naive streaming panel, removed mid-stream, kept reading the provider's stream and then started the answer check for a view that no longer existed, without a single exception. In the search box, disposal aborted the request 80 ms into a 300 ms query, and the ignoring endpoint finished it anyway in every run. The semantic search component releases the ONNX session and terminates the worker; dropping the reference to a worker is not a release. The rule from timeouts and cancellation in .NET holds in the browser too: ending a wait does not end the work.
The measured numbers side by side
Every number below is quoted from a published deep dive and its solution's results/ folder. All runs used Release builds on .NET 11.0.0 (SDK 11.0.100) on Windows Server 2022, an AMD EPYC 7502P with 64 logical processors, a shared machine, with headless Chrome 157 driven by playwright-core and everything on loopback unless a row says otherwise. Loopback makes network time close to zero, so bytes and request counts are the real cost on a real link; absolute times are this machine's. The tables are not comparable with each other: each answers its own question with its own harness.
What rendering a streamed answer costs on Interactive Server
| Per answer (73 chunks, simulated model) | Render every chunk | At most every 50 ms |
|---|---|---|
| Render batches received, mean | 78.0 | 27.9 |
| Kilobytes received in render batches, mean | 35.3 | 12.6 |
StateHasChanged time per answer, p50 / p99 | 5.4 / 13.2 ms | 1.8 / 2.1 ms |
| Chunk handed to the component until visible, p50 / p99 / max | 0.4 / 0.8 / 8.2 ms | 24.4 / 49.9 / 50.6 ms |
| Click until the final state, p50 / p95 | 2,327 / 2,857 ms | 2,328 / 2,853 ms |
Source: Streaming AI Answers in Blazor, 25 answers per row of the guarded panel.
What the live model looked like
gpt-5.4-mini, low reasoning effort, 10 answers | p50 | p95 |
|---|---|---|
| Request to the first text from the model | 620 ms | 896 ms |
| Click to the first text on screen | 666 ms | 941 ms |
| Click to the final state | 1,112 ms | 1,586 ms |
| Gap between text chunks | 0.2 ms | 19 ms |
| Text chunk handed to the component until visible | 27.7 ms | 48.3 ms |
| First text chunk until visible (before the empty-update fix) | 46.4 ms | 50.8 ms |
Source: Streaming AI Answers in Blazor, live run through Microsoft.Extensions.AI.OpenAI 11.0.0 over the internet, guarded panel with the 50 ms throttle: 43 text chunks and 10 render batches (3.9 KB) per answer on average.
What the browser downloads before the first local query
| Page (5 fresh profiles each) | Requests | Bytes sent by the server | Search box usable, p50 |
|---|---|---|---|
| Local, int8 model, first visit | 58 | 40.6 MB | 1,446 ms |
| Local, int8 model, second visit (Cache Storage) | 10 | 0 | 1,213 ms |
| Local, float32 model, first visit | 58 | 108.0 MB | 1,923 ms |
| Server mode, first visit | 47 | 2.6 MB | 628 ms |
Source: Semantic Search in Blazor WebAssembly, response body bytes counted by the server.
What one semantic query costs, browser against endpoint
| Path (200 queries each) | Input to rendered hits, p50 / p95 / p99 | Inference only, p50 |
|---|---|---|
| Browser, int8 | 14.6 / 19.2 / 20.7 ms | 11.7 ms |
| Server, int8 | 11.2 / 16.2 / 20.2 ms | 5.2 ms |
| Browser, float32 | 19.0 / 24.3 / 26.3 ms | 15.9 ms |
| Server, float32 | 13.7 / 19.9 / 21.2 ms | 7.2 ms |
Source: Semantic Search in Blazor WebAssembly, 10 rounds of 20 questions after 5 warm-up queries, single-threaded WebAssembly against one ONNX Runtime thread on the server, loopback.
What a search box sends while someone types
| "cable tester", 12 keystrokes, 8 runs each | Requests | Aborted by the browser | Finished on the server | Query time on the server | List right after the last key, p50 |
|---|---|---|---|---|---|
| Naive handler | 12 | 0 | 12 | 1,900 ms | 106 ms |
| Generation only | 12 | 0 | 12 | 1,900 ms | 106 ms |
| Generation + cancellation | 12 | 3.4 | 12 | 1,900 ms | 106 ms |
| Same, endpoint honors the abort | 12 | 3.5 | 9 | 1,230 ms | 105 ms |
| All three, debounce 250 ms | 2 | 1 | 2 | 200 ms | 357 ms |
Source: The Hidden Network Work of a Blazor Search Box, Blazor WebAssembly, query costs simulated (600, 300 and 100 ms by prefix length). The ignoring endpoint kept working up to 513 ms after an abort had arrived.
The expensive outcomes were never the milliseconds of the component. The throttle saved about 3.6 ms of render time per answer (5.4 against 1.8 ms at p50); the model's first token took 620 ms. A stale handler cost a wrong amount under the right policy at unchanged latency. A search box without debounce cost the server ten more queries per search than the debounced one, and nobody saw them. Decide where the work runs and who owns each write first, then tune.
Read this next
- My streamed answer mixes two questions, or the spinner stops while text still arrives. Streaming AI Answers in Blazor: Stop Old Requests Rewriting the View builds the guarded panel, opens the Blazor Server renderer, throttles renders and runs against
gpt-5.4-mini; 31 tests script every ordering without sleeping. - Should our semantic search run in the browser? Semantic Search in Blazor WebAssembly: Where the Cost Moves measures the first visit by resource and per-query time against an endpoint, finds a tokenizer mismatch and int8 drift, and ships the worker and Cache Storage code.
- The search box shows results for the wrong text, or the server keeps working after the user moved on. The Hidden Network Work of a Blazor Search Box follows a cancelled
HttpClientcall to afetchabort andRequestAborted, and tests debounce and cancellation on a fake clock with bUnit. - Which documents may the answer use at all? RAG in .NET, Part 2: Retrieve What the Caller May Use filters by tenant, grant and the revision in force before the top-k cut, and measures what retrieval without those rules leaks.
- How do the documents and their vectors get there, and what does an index miss? RAG in .NET, Part 1: Restartable Ingestion and an Index Under Load publishes revisions instead of rows and measures what an HNSW index finds under filters and updates.
- The answer cites the right document. Is the number in it right? RAG in .NET, Part 3: Verify the Answer, Not the Citation turns the streaming panel's simple grounding check into executable checks for numbers, scope and negation.
- What actually happens to the server's threads while those requests wait? Async in .NET 10 and 11 from the Inside maps the awaits, timeouts and cancellation underneath every pattern here.
Decision guide for AI features in Blazor
| You need or see | First move | Watch for |
|---|---|---|
| A model call with a secret key | Call it on the server: in the circuit (Interactive Server) or behind your own endpoint (WebAssembly) | Anything shipped to the browser, persisted prerender state included, is readable |
| A streamed answer on Interactive Server | Throttle renders on a clock with a trailing render | Per-chunk renders become per-chunk network batches; the 10-batch buffer fills on slow links |
| A streamed answer on WebAssembly | Stream from your endpoint; .NET 10 streams browser responses by default | Pass the token so the browser aborts the fetch, and pass RequestAborted on to the provider |
| A user can ask again, Stop or leave mid-answer | A revision and a token per request, checked before every write after an await | Stop and Dispose must advance the revision; cancelling does not refund tokens |
| Public documents searched many times per visit | Embed queries in a Web Worker, model in Cache Storage under a versioned name | 40.6 MB before the first query; tokenizer and runtime must match what embedded the documents |
| Visitors search once, or documents depend on permissions | Server-side embedding and retrieval | Measure the round trip you skipped on loopback |
| Search as you type | Debounce with the same token as the request, plus a generation check | Debounce costs latency (357 ms against 106 ms) and is not admission control |
| Abandoned requests load the server | Pass RequestAborted into every downstream call | Cancellation in the component alone left all 12 queries running |
A component loads AI data in OnInitializedAsync | [PersistentState], or wait for RendererInfo.IsInteractive | With prerendering the call runs twice per full page load |
Checklist
- Every AI component has a chosen render mode, and its model calls run where the key is.
- Each request takes a revision, generation or ticket before its first
await, and every write after an await checks it immediately before writing, including incatchandfinally. - Stop and disposal advance the revision and cancel the token; partial answers stay visible and are marked incomplete.
- Streaming renders on Interactive Server are throttled with a trailing render, and updates without text do not use up a render window.
- Search inputs are debounced with the request's token, stale failures are caught and dropped, and endpoints pass
RequestAbortedinto every database and HTTP call. - Client-side models run in a dedicated worker with one active and one pending query, are cached under a versioned name, and are released on dispose.
- No model or embedding call runs during prerendering without persisted state; nothing private is shipped to WebAssembly.
Further reading
- ASP.NET Core Blazor render modes: where Static, Interactive Server, WebAssembly and Auto render, and prerendering defaults.
- Blazor prerendered state persistence: the second
OnInitialized,[PersistentState]and what reaches the browser. - Blazor synchronization context: re-entrancy at incomplete awaits and disposal before resumption.
- What's new in ASP.NET Core 10:
HttpClientresponse streaming on by default in Blazor WebAssembly, declarative persistent state. - RemoteRenderer.cs (dotnet/aspnetcore, release/11.0): render batches, acknowledgements and the unacknowledged-batch limit.
- BrowserHttpHandler.cs (dotnet/runtime, release/11.0): how a cancelled token becomes a
fetchabort. - .NET on Web Workers: moving CPU-heavy work off the browser's main thread.
- Microsoft.Extensions.AI:
IChatClientand streaming responses.