Hash Aggregates, Parallel Plans and Memory Grants: Read the Spill Before Tuning It
Four actual SQL hash-aggregate plans expose grants, parallelism and spills while preserving one independently checked result.
Explore the mechanism ↓
Reading tools Listen or translate
Read aloud
Uses an installed voice on your device.
Translate article
Machine translation. Code and evidence notes stay in English.
Original English text.
START WITH THE MECHANISM
Interactive companion and laboratory update: 12 November 2026. The editorial date places the topic on the timeline; this current explanation and its measured evidence retain their actual preparation and execution dates.
THE FULL INVESTIGATION
Hash Aggregates, Parallel Plans and Memory Grants: Read the Spill Before Tuning It
Dates and technology context
This is a retrospective editorial timeline. Topic context: 17 September 2026. First publicly available: 12 November 2026. Current text, visuals and laboratory revisions were prepared on 12 November 2026.
The 200,000-row/40,000-group fixture, all four actual spill plans, grant/DOP observations and timings are 2026-11-12 measurements. No earlier spill-free baseline may be invented.
A query returns one row, but its plan has to group a much larger intermediate set. The actual plan shows a spill warning. Someone proposes a larger memory grant, someone else proposes more parallelism, and another person wants to remove the hash operator entirely. Each suggestion changes a different part of the execution, and none is justified by the warning icon alone.
The useful question is what the engine actually requested, received and used, which operator spilled, and whether the intended result stayed the same across the alternatives. Parallelism can change the plan and its memory requirements. A grant hint can change resource allocation without behaving like a simple percentage of the container's memory. A faster local command can still be a poor choice under concurrent production traffic.
This article uses a real SQL Server 2022 experiment with two hundred thousand synthetic rows and forty thousand logical groups. Four controlled variants combine MAXDOP one or two with an unconstrained-by-this-query grant choice or a MAX_GRANT_PERCENT value of 0.01. Every variant uses HASH GROUP and RECOMPILE. All return the same independently checked aggregate.
The diagnostic captures contain actual spill evidence in all four variants. There is no invented spill-free baseline. The capped serial case reports a deeper spill level than the uncapped serial case, and the parallel cases report degree of parallelism two. The article follows those observations without turning this small local fixture into a universal configuration recommendation.
Make the intermediate work visible in the result contract
01 / See the idea
A compact result can require a wide working set
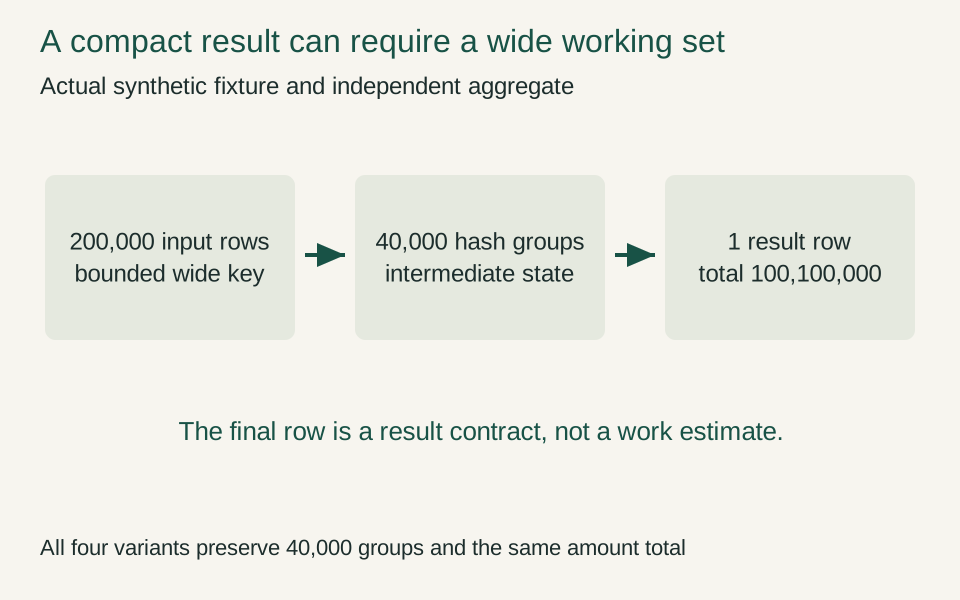
The grouping key includes a bounded payload. The independent oracle holds the answer fixed while plan options change.
Interpretation and evidence
- Count intermediate groups.
- Preserve result semantics.
- Do not infer cost from output size.
The base table contains identifiers one through two hundred thousand. Bucket is identifier modulo forty thousand. Payload contains a textual representation of that bucket followed by a fixed run of characters, and Amount is identifier modulo one thousand plus one.
Each bucket therefore appears five times with the same payload. The inner query groups by Bucket and Payload and sums Amount. The outer query counts those groups and sums their amounts. The final result is one row containing forty thousand groups and a total of 100,100,000.
The independent oracle calculates the total directly from the generator's arithmetic and records distinct bucket values in a C# set. It does not use a second SQL statement to certify the first. Every diagnostic and timed execution must match those expected values before its performance observations are retained as a successful case.
The payload width is deliberate. Grouping only a narrow integer would exercise a different memory shape. Here the group key includes a bounded varchar payload, making the intermediate hash state meaningful while keeping the dataset small enough for a controlled shared-machine laboratory.
The table is not a model of every production distribution. Its groups are regular, its rows are synthetic and its key relationship is deterministic. The fixture is useful because it exposes a mechanism and supports exact correctness checks, not because it resembles an unnamed customer database.
The query's final output size is particularly misleading as a cost proxy. One result row does not imply one row of database work. The engine must process the input, maintain grouping state and produce the inner groups before the outer aggregate can return its compact answer.
Keep the query family explicit
The executed query shape is:
SELECT COUNT_BIG(*) AS Groups, SUM(GroupAmount) AS Total
FROM
(
    SELECT Bucket,Payload,SUM(CAST(Amount AS bigint)) AS GroupAmount
    FROM dbo.Events
    GROUP BY Bucket,Payload
) AS G
OPTION(HASH GROUP,RECOMPILE,MAXDOP 1);
The four variants change only the MAXDOP option and the presence of MAX_GRANT_PERCENT=0.01. The query still groups the same columns and returns the same aggregate. The table, data and statistics remain the same within the run.
HASH GROUP is an explicit experimental choice. It requests hashing for the grouping operations so that the exercise can study that mechanism. The baseline is therefore not an unhinted optimizer recommendation. It is the uncapped member of a deliberately constrained query family.
RECOMPILE is another important choice. Each execution receives a new compilation, so the experiment does not rely on a reused plan adapting its grant through memory grant feedback. Compilation is inside the command lifecycle being timed. The result should not be described as a warmed cached-plan throughput benchmark.
The use of hints here is instructional and bounded. Microsoft's query-hint documentation identifies their scope and cautions that they should be used deliberately. The experiment does not recommend copying its hints into production merely because one variant happens to finish sooner locally. Microsoft: query hints
The finite family also makes the interpretation easier to audit. If result semantics, key width, query shape and degree of parallelism all changed at once, an observed difference would be difficult to explain. Keeping most inputs stable lets the actual plans show which execution properties changed with the selected options.
Distinguish the limits surrounding the query
The SQL Server container is capped at two CPUs and four GiB of memory. It receives an MSSQL_MEMORY_LIMIT_MB setting of 3072 through the wrapper. The database uses compatibility level 160. The actual server build is 16.0.4315.2, and the client runs on .NET 11.0.0 with Microsoft.Data.SqlClient 5.1.6.
The recorded SQL configuration reports cost threshold for parallelism five and server max degree of parallelism zero. The query options explicitly request MAXDOP one or two. The experiment does not change the server-wide threshold to force a desired outcome, and it does not infer that the threshold alone determines the resulting plan.
The reported max server memory configuration value is also preserved separately from the container and environment limits. Those are different controls and should not be collapsed into one number called available query memory. The actual MemoryGrantInfo fields are the evidence for what this query requested and received.
The MAXDOP two cases actually produce plans with degree of parallelism two. The serial plans report DegreeOfParallelism zero in the saved XML while the statement uses MAXDOP one. The article preserves that representation rather than rewriting the raw value to make every field match the option text visually.
A configured maximum is not a guarantee that every query uses that many workers. Likewise, a cost threshold is not a universal elapsed-time boundary. The relevant observation is the actual plan produced for the selected statement under the recorded environment.
This separation is especially useful on containerized hosts. CPU quota, visible processors, SQL configuration and query-level options can describe different aspects of the execution environment. A reproducible report records those inputs and inspects the actual plan instead of assuming that a resource cap supplies every answer.
Capture actual grants and spills separately from timing
The diagnostic path enables STATISTICS XML and STATISTICS IO, executes the query and drains all result sets. It saves the actual plan XML and informational messages. The result row is checked against the independent oracle, and a missing plan causes the diagnostic check to fail.
The dedicated timing loop does not enable plan collection. It executes three observations per variant with the order reversed in alternating rounds. This keeps the cost of collecting and returning the XML outside the reported no-diagnostic command samples.
Both paths use the same query text, data and options. Their evidence is related, but it is not interchangeable. The plan describes the diagnostic execution's grant and spill details; the stopwatch describes the separate command observation. The report does not pretend that every timed sample has its own independently captured plan.
The plan parser extracts query-level memory-grant attributes, actual degree of parallelism, hash operators and warning elements. It preserves the warning XML rather than reducing every spill to a Boolean. The raw artifact remains available for properties the summary does not display.
STATISTICS XML reports actual execution information after running the statement. It is not merely an estimated-plan request. That distinction matters because a predicted memory need and an observed spill are different kinds of evidence. Microsoft: SET STATISTICS XML
The diagnostic data also prevents a common storytelling error. We expected that a tight grant might make spilling visible, but the uncapped variants spill too. The article keeps that result. It does not relabel the uncapped plan as spill-free because such a contrast would make a simpler chart.
Read requested, granted and used memory as separate fields
02 / A concrete example
Requested, granted and used are not synonyms
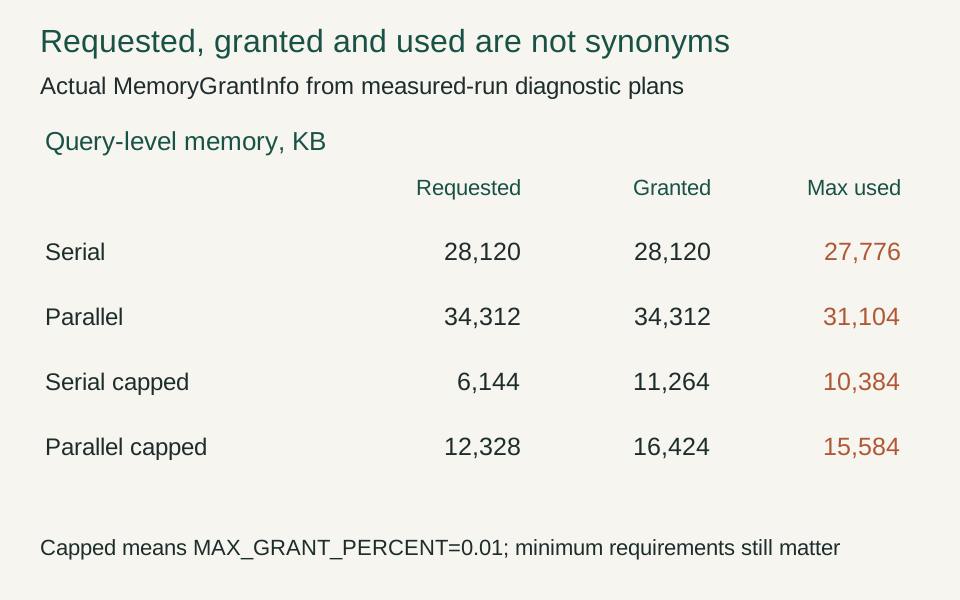
The percentage hint is not a literal percentage of container memory allocated to every query. Query-level values also differ from individual operator spill counters.
Interpretation and evidence
- Preserve each field separately.
- Read default-pool semantics.
- Do not mix query and operator accounting.
The diagnostic captures made during the dedicated measured run report the following query-level values. Memory columns retain the plan's kilobyte units:
| Variant | Requested KB | Granted KB | Max used KB | Spill level |
|---|---|---|---|---|
| MAXDOP 1 | 28,120 | 28,120 | 27,776 | 1 |
| MAXDOP 2 | 34,312 | 34,312 | 31,104 | 1 |
| MAXDOP 1, cap 0.01% | 6,144 | 11,264 | 10,384 | 2 |
| MAXDOP 2, cap 0.01% | 12,328 | 16,424 | 15,584 | 1 |
All four have a recorded grant wait time of zero in these captures. That does not prove grant waits can never occur under another workload. It means the current plans do not support attributing their elapsed time to a measured wait for the grant.
RequestedMemory is not the same field as GrantedMemory, and MaxUsedMemory is another observation. The saved plans contain cases where the final granted value differs from the requested value. The article reports those values rather than assuming the grant must equal the request.
The capped variants do not receive a literal 0.01 percent of four GiB as a simple fixed allocation. The query-hint documentation distinguishes default-pool behavior from a user-defined resource pool and states that the default pool can provide the minimum memory required to run. The fixture does not create a custom resource pool. Microsoft: MAX_GRANT_PERCENT semantics
The plan also exposes required and desired memory. Those values help explain why a requested cap is not a complete description of execution requirements. They should not be confused with the memory occupied by the base table, the process working set or the container's total memory allowance.
Operator-level HashSpillDetails contains its own granted and used values. These belong to that operator's reported context and do not necessarily equal the query-level MemoryGrantInfo values. Mixing the two levels can produce contradictory-looking numbers that are actually describing different boundaries.
The current experiment does not derive a complete internal memory-accounting model from those fields. It identifies what the engine reported and connects it to the observed spill. A deeper attribution of every difference would require additional runtime-specific evidence rather than a confident explanation based only on names.
The spill warning is evidence of a mechanism, not a diagnosis by itself
03 / Watch the mechanism
The spill is observed, not assumed
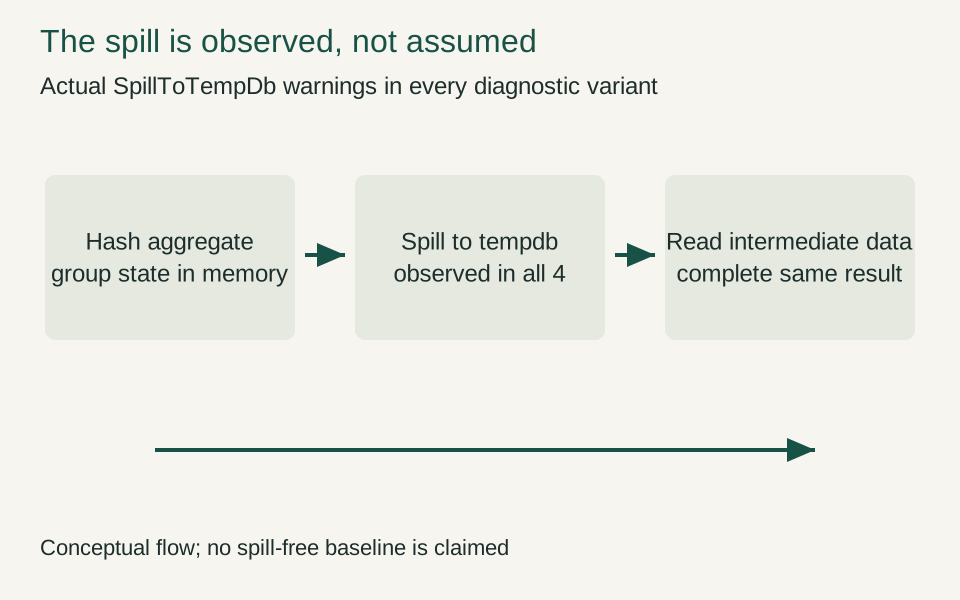
Static view. Play to see how the mechanism unfolds.
The serial capped plan reports level2, while the other three report level1. Motion explains the work path without claiming device latency.
Interpretation and evidence
- Retain actual warning evidence.
- Do not invent a clean baseline.
- A warning does not choose the repair.
All four diagnostic plans contain SpillToTempDb and HashSpillDetails. The serial uncapped case reports spill level one, while the capped serial case reports level two. The two parallel variants report level one with two spilled threads. The warning is therefore observed, not inferred from a slow query or a low grant alone.
The operator detail includes writes to and reads from tempdb for the spill. Those fields are preserved exactly in the raw XML. They should not be casually relabelled as milliseconds, physical disk bytes or total database I/O. The article uses them as evidence of additional intermediate work in the reported operator.
The fact that the uncapped plan spills is important. Removing an explicit cap does not guarantee a spill-free execution. The actual grant, group state, key width and execution strategy all matter. This fixture demonstrates that point without claiming to isolate every internal cause of the uncapped spill.
The cardinality estimate for the inner hash aggregate is also noticeably different from the actual forty-thousand-group result. The saved plan estimates approximately 199,992 rows there. That discrepancy is relevant evidence, but it does not by itself prove which part of the grant calculation produced the spill.
The temptation is to turn every warning into the same repair: increase memory until the warning disappears. That can improve one query while reducing concurrency elsewhere. A grant is a shared-resource decision, and the current single-query experiment does not measure the server-wide tradeoff under concurrent traffic.
A useful next question is therefore specific. Is the grouping state wider than necessary? Is the estimate misleading? Does a different representation reduce work while preserving the result? Is the grant excessive or insufficient for the intended workload? The warning helps identify a mechanism, but the repair still needs an application and resource contract.
Parallelism changes more than elapsed time
The parallel plans use degree of parallelism two and have different required and desired memory values from the serial plans. Their warning records identify two spilled threads. These observations show that parallelism participates in the resource shape of the query, not merely in a promise to divide execution time by two.
The query still returns one result row, but intermediate work can be distributed and combined. That distribution introduces its own execution responsibilities. The actual plan, not the MAXDOP text alone, is the evidence for which operators and exchanges were chosen.
The container's two-CPU cap makes the comparison bounded. It does not represent a production server with many concurrent queries, uneven NUMA placement or a different storage path. A local parallel speedup, if observed, would not prove that increasing parallelism improves the whole service.
The opposite conclusion would also be too broad. If a small parallel case is slower, that does not prove parallel execution is generally harmful. Coordination overhead, query size, memory behavior and host scheduling can influence the result. The experiment compares this query family under one recorded resource envelope.
The appropriate interpretation combines correctness, plan shape, grant fields, spill evidence and timing. Looking at only one of those can hide a tradeoff. A faster command that consumes a larger grant may be useful for a latency-sensitive isolated job and problematic for a busy shared server.
The study does not change the global MAXDOP setting or cost threshold. It uses query-level options and records the unchanged server values. That keeps the demonstration from implying a blanket configuration recommendation based on one synthetic aggregate.
Read the no-diagnostic timings with their limits visible
04 / A concrete example
Compare the actual command observations
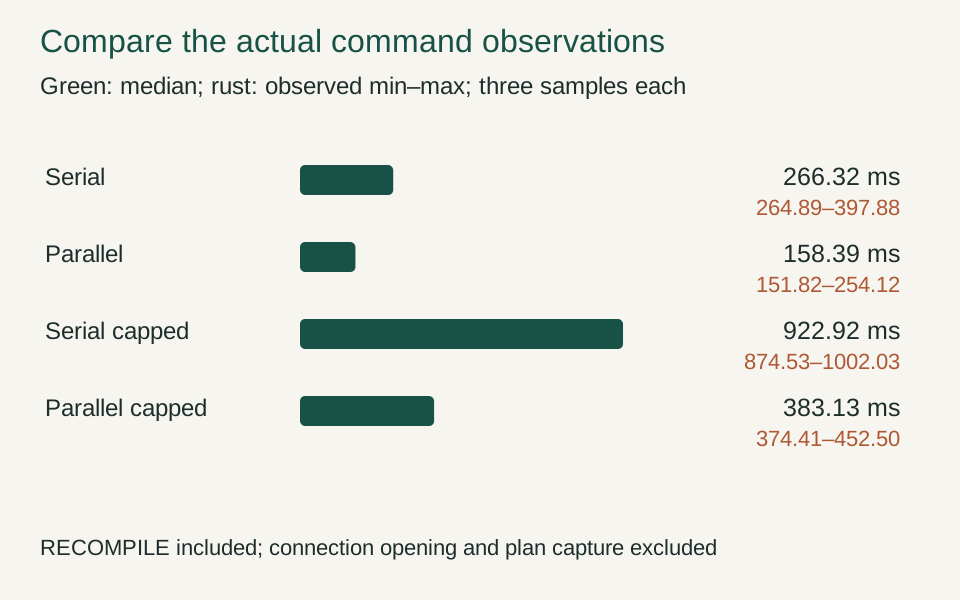
The capped serial case is slowest in this series and also has the deeper diagnostic spill. The table does not isolate each internal cause or predict production concurrency.
Interpretation and evidence
- Keep all four variants.
- Show observed ranges.
- Do not label three samples p99.
The no-diagnostic series contains these actual command observations:
| Variant | Median ms | Observed min–max ms | Samples |
|---|---|---|---|
| MAXDOP 1 | 266.3193 | 264.8896–397.8775 | 3 |
| MAXDOP 2 | 158.3932 | 151.8245–254.1164 | 3 |
| MAXDOP 1, cap 0.01% | 922.9183 | 874.5303–1002.0262 | 3 |
| MAXDOP 2, cap 0.01% | 383.1309 | 374.4149–452.5047 | 3 |
Within this local series, the uncapped parallel variant has the lowest median, and the capped serial variant the highest. The latter also has the deeper observed spill level. Those facts are consistent with additional intermediate work, but they do not isolate every component of the elapsed-time difference.
The command timer begins before ExecuteReaderAsync and ends after all result sets are drained. Connection opening and fixture creation occur outside it. RECOMPILE remains in the query, so compilation is part of the executed command lifecycle.
There are three measured observations per variant, not a production latency distribution. The order alternates between rounds to reduce one simple form of ordering bias, but that does not eliminate shared-host variability or make the sample statistically representative.
The result contract remains fixed in every observation: forty thousand groups and total 100,100,000. A faster query with a changed grouping key or omitted input would fail the oracle rather than become a successful optimization.
The diagnostic spill details describe their own executions. They support the mechanism discussion, while the separate timings describe local command cost. The report does not attribute every millisecond to tempdb or claim that the difference between two medians equals the cost of a particular spill level.
This is the right level of precision for the evidence available. We can say which variants returned the correct result, which diagnostic plans spilled, how their grants differed and what durations were observed. We cannot derive an SLA, a universal parallelism rule or a production memory budget from three local samples.
Do not silently rely on memory grant feedback
SQL Server can adjust grants for repeated eligible workloads through memory grant feedback. That behavior can make successive executions differ, and its eligibility and persistence depend on the relevant engine features and settings. A comparison that ignores this can accidentally mix first-execution and adapted behavior.
The current query explicitly uses RECOMPILE. Microsoft's documentation notes that a recompiled statement does not cache its plan for that execution's memory grant feedback. The diagnostic plans report No: First Execution for the feedback-adjusted field. Microsoft: memory grant feedback
That choice does not make feedback unimportant. It removes one changing mechanism from this bounded comparison. A production workload that benefits from cached-plan feedback should be tested under that lifecycle rather than treated as equivalent to the fixture.
The distinction also affects how a team reproduces a spill. If a query's behavior changes after several executions, preserve the execution order and relevant plan history. A single screenshot from the final run may hide the earlier grant that caused the original issue.
Conversely, forcing repeated recompilation in production merely to match a laboratory could remove useful adaptation or add compilation cost. The experiment's control is not automatically a deployment recommendation. Its purpose is to make the selected evidence interpretable.
The broader lesson is to identify which state carries between executions. Cached plans, feedback, warmed data pages and connection pools all affect what a repeated query means. A performance result is easier to trust when the report names those lifetimes rather than describing every repetition as the same experiment.
Keep base-table I/O separate from spill evidence
05 / A concrete example
Keep table access and spill work separate
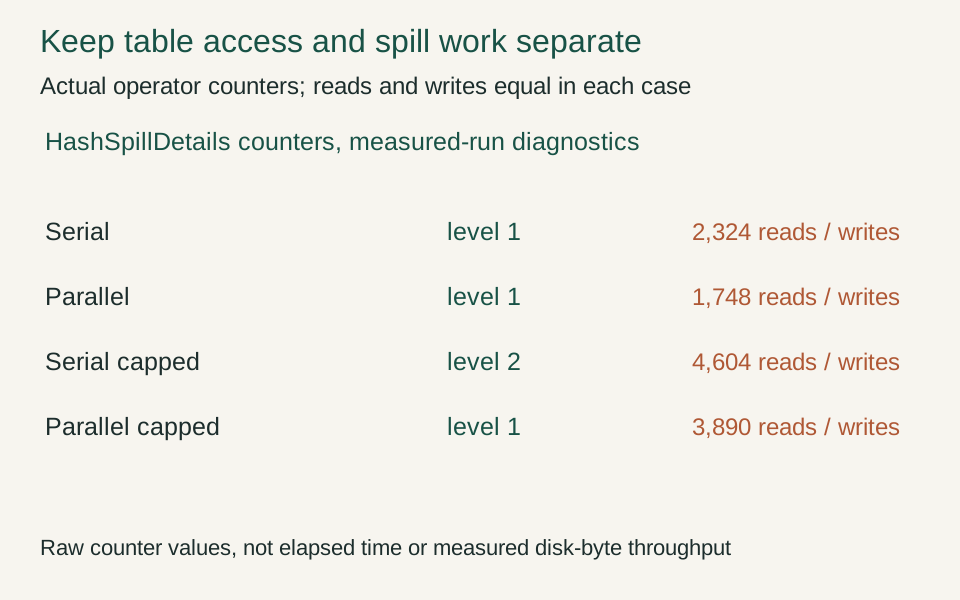
A similar base scan can feed different intermediate work. The raw XML preserves the measurement level so the counters are not added indiscriminately.
Interpretation and evidence
- Name the counter’s boundary.
- Do not relabel counters as bytes.
- Keep run provenance attached.
The diagnostic I/O messages report 5,574 logical reads from Events for the serial cases. The parallel cases report their own access counts in the saved messages. Those counts describe the table-access observations and should not be substituted for the HashSpillDetails fields associated with the aggregate.
The point is not to add every number into one larger total. Logical reads, operator spill reads and command elapsed time are different measurements. A table scan can remain broadly similar while the intermediate aggregation performs more tempdb work. The extra work does not have to appear as a larger result or a different final row count.
The saved spill details make that separation concrete. In the measured diagnostic serial case, the hash operator reports 2,324 writes to tempdb and the same number of reads. The capped serial case reports 4,604 for each. These are the raw operator counters, not a separately measured storage throughput rate.
The parallel uncapped and capped captures report 1,748 and 3,890 respectively for each of those spill counters. The values differ from the earlier correctness capture for the parallel cases, so the article consistently uses the dedicated measured run's diagnostic artifacts in its tables. The earlier results remain preserved rather than being silently merged.
That variation is a reason to keep provenance attached to every chart. A report assembled from the fastest timing, largest grant and smallest spill count across different executions could describe a plan that never existed as a single observed state. The current package keeps the diagnostic and timing records named by run and variant.
The experiment does not measure tempdb device latency, storage saturation or concurrent spill contention. It shows actual spill activity and the associated local command observations. If a production decision depends on the storage subsystem, that boundary needs its own measurements under the relevant concurrency and durability conditions.
Decide what would count as a successful repair
Removing a warning is not automatically the right acceptance criterion. A larger grant might eliminate a spill while reserving memory that other queries need. A narrower grouping key might reduce memory but change the result if the removed field was semantically significant. A parallel plan might reduce one query's latency while consuming more shared execution capacity.
The repair should therefore name its intended outcome before the next run. For an isolated batch, elapsed time within a memory budget may be appropriate. For a shared transactional service, concurrency and tail behavior may matter more. In either case, the independent aggregate remains a nonnegotiable correctness check.
The current data supports a limited conclusion about the capped serial variant: it requests less memory, receives a smaller grant than the uncapped serial variant, reports a deeper spill and takes longer in the selected no-diagnostic observations. It does not prove that the cap is harmful for every query or that all memory caps should be removed.
That disciplined conclusion is enough to choose a useful next experiment. It avoids both extremes: treating every optimizer decision as untouchable and treating every warning as permission for a global tuning change. The plan is evidence about one execution, and the application workload supplies the decision it must serve.
Choose the next experiment from the unresolved decision
The fixture establishes a real hash-spill mechanism and a resource tradeoff across four options. It does not yet decide the best production repair. That decision depends on the operation's latency requirement, concurrent workload, data distribution and tolerance for memory consumption.
A useful follow-up might reduce the grouping key width, compare a different aggregation strategy or test the same query under a representative concurrency limit. Each would answer a different question. Changing all of them at once would make it difficult to identify why the result changed.
The same discipline applies to removing hints. The current baseline includes HASH GROUP and RECOMPILE by design. An unhinted optimizer-selected plan would be another candidate, not a result already implied by the uncapped cases. It should be captured and validated explicitly if it becomes relevant to the deployment decision.
The evidence package preserves the exact SQL, generator, actual plans, I/O messages, grant summaries and raw timings. It also records the container's removal. The diagrams explain the selected relationships while leaving the underlying observations available for review.
The final conclusion is deliberately concrete: in this SQL Server execution, all four controlled hash-aggregate variants returned the same independently checked result and all four produced actual spill warnings. Degree of parallelism and grant options changed the resource observations, and the capped serial plan showed a deeper spill. Those facts are a starting point for a reasoned tuning decision, not a substitute for one.
Source code and execution evidence
Download the complete lab, source record and raw execution results. This package supports the specific execution claims in this article. It is not a production certification.