Following Async Work Without Confusing It With the Thread Stack
A real .NET 11 trace reveals logical async chains, a short-process buffer trap and the limits of method mapping and observation-cost measurements.
Explore the mechanism ↓
Reading tools Listen or translate
Read aloud
Uses an installed voice on your device.
Translate article
Machine translation. Code and evidence notes stay in English.
Original English text.
START WITH THE MECHANISM
Interactive companion and laboratory update: 12 November 2026. The editorial date places the topic on the timeline; this current explanation and its measured evidence retain their actual preparation and execution dates.
THE FULL INVESTIGATION
Following Async Work Without Confusing It With the Thread Stack
Dates and technology context
This is a retrospective editorial timeline. Topic context: 11 November 2026. First publicly available: 12 November 2026. Current text, visuals and laboratory revisions were prepared on 12 November 2026.
Actual .NET11 trace, decoder, symbol candidates, counts and observer-cost experiment are dated 2026-11-12. Preserve the incomplete first capture and unresolved address as current evidence.
A thread stack answers a concrete question: what is this thread executing at the instant represented by the observation? An asynchronous operation asks a different question: which suspended calls are waiting for this result, and how did execution reach its current continuation?
Those questions overlap, but they are not interchangeable. When a method suspends at an incomplete await, the operation remains meaningful even though its callers need not remain on the executing thread's physical stack. Looking only at the resumed thread can therefore hide the relationship that explains why the work exists.
.NET 11's async profiling events provide another kind of evidence. In this article, a small executed program produces a logical chain containing Inner, Middle, Outer and Main. A decoder follows the runtime's emitted format, checks its boundaries and uses method ranges from the same trace to attach candidate names. The result is useful precisely because we keep its limitations visible.
This is not a claim to have built a general-purpose profiler. It is a reproducible investigation of one trace from one known workload, followed by a bounded observation-cost experiment. There are no production incidents, customer results or invented efficiency percentages behind it. The code, trace, decoder and measurements were prepared on 12 November 2026 using SDK 11.0.100 and runtime 11.0.0.
Begin with two questions, not one stack picture
01 / See the idea
Two useful views, two different questions
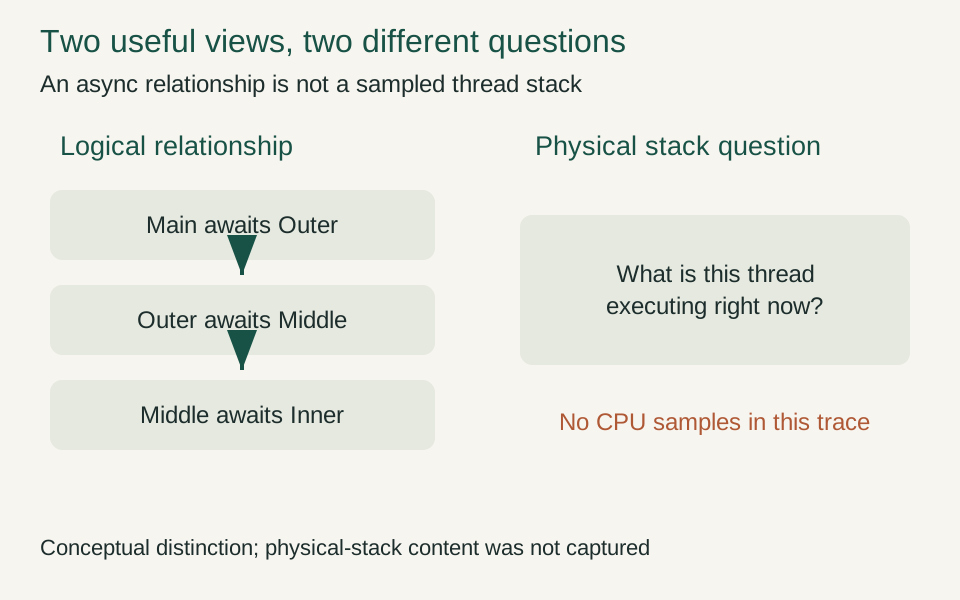
Suspended callers can remain part of the operation while absent from the current physical stack. This recording answers logical-chain questions without claiming sampled CPU evidence.
Interpretation and evidence
- Separate logical and physical views.
- Elapsed wait is not continuous CPU work.
- Request CPU samples for CPU attribution.
Suppose a request enters Outer, which awaits Middle, which awaits Inner. Inner schedules a timer and yields. During the waiting interval, a thread may be free to execute unrelated work. When the timer completes, a thread resumes the continuation. The source-level relationship still matters: the result must eventually travel back through the waiting calls.
A physical stack sample could show the continuation currently executing, runtime dispatch machinery and whatever synchronous calls are active at that moment. A logical async chain describes suspended or resumed relationships across those boundaries. Drawing one as though it were the other creates misleading explanations about thread ownership and where time was spent.
The distinction becomes especially important when someone sees a long operation duration and concludes that a thread was busy for the same duration. A delay can contribute elapsed time without consuming a thread continuously. Conversely, a brief-looking continuation can perform enough CPU work to dominate a service's throughput. Neither claim follows from a chain diagram alone.
This laboratory deliberately contains both Task.Yield and Task.Delay. Yield creates an asynchronous scheduling boundary; Delay creates an incomplete wait under the observed execution. We inspect the emitted relationships rather than inferring them solely from the source. We also retain application markers because the runtime's identifiers are not automatically the application's operation identifiers.
The trace described here does not enable a CPU sampling profile. Consequently, it cannot establish sampled CPU attribution, a physical stack distribution or a flame graph of processor time. Runtime rundown information helps identify method address ranges; it does not turn the recording into a CPU sample stream.
Use a workload whose answer is independently checkable
The workload performs one hundred operations sequentially. Operation i enters Outer with i, passes through Middle and Inner, and returns i plus one. The final checksum must therefore be 5,050. The arithmetic is independent of the tracing infrastructure and gives the run an uncomplicated correctness boundary.
These are the three executed methods, including the application markers used by the analyzer:
[MethodImpl(MethodImplOptions.NoInlining)]
static async Task<int> Outer(int value){Phases.Log.Begin(value);var result=await Middle(value);Phases.Log.End(value);return result;}
[MethodImpl(MethodImplOptions.NoInlining)]
static async Task<int> Middle(int value){Phases.Log.Stage(value,1);await Task.Yield();Phases.Log.Stage(value,2);return await Inner(value);}
[MethodImpl(MethodImplOptions.NoInlining)]
static async Task<int> Inner(int value){Phases.Log.Stage(value,3);await Task.Delay(1);Phases.Log.Stage(value,4);return value+1;}
The marker sequence for each operation is Begin, stage 1, stage 2, stage 3, stage 4 and End. In words, it records entry, the two sides of Yield, the two sides of Delay and completion. The analyzer requires this order for all one hundred operation identifiers. Merely counting six hundred markers would not catch two stages being swapped or an event being attributed to the wrong operation.
The methods are deliberately small. They are not a realistic service benchmark, and the one-millisecond argument to Delay is not a promise that every operation finishes in exactly one millisecond. Scheduling and timer behavior remain part of the actual execution. We use this shape because it creates inspectable suspension boundaries with a known result.
The project explicitly enables runtime async generation. That setting is part of the experiment, not an assumption that every .NET 11 application automatically uses the same generated form. The package includes the project file and SDK pin so the reader can distinguish the selected compiler behavior from the runtime version alone.
The checksum proves that the selected computation completed correctly. The stage checks prove the observed marker order. Neither proves that every possible runtime event was captured, that all methods can be symbolized or that the profiler has negligible cost. Each of those questions needs its own evidence.
Read the shipped format before trusting a parser
The investigation began with a pull-request diff, but the decoder was written against the v11.0.0 runtime sources. That choice changed the implementation. The shipped source contains distinct runtime-async and state-machine event families, a manifest describing payload boundaries and event-specific versions. A decoder copied from an earlier draft could assign the wrong meaning to otherwise plausible bytes.
The selected provider is System.Runtime.CompilerServices.AsyncProfilerEventSource. This experiment uses keyword mask 0x3ff for the runtime-async event family. The provider's public trace event carries a byte buffer containing multiple internal records. Its event count is therefore not the number of logical transitions. Runtime provider source, v11.0.0
The decoder validates the outer length, batch version, total size and declared record count. It then uses the metadata manifest to find each record's payload length field. The final cursor position and timestamp must agree with the batch header. Unsupported versions fail explicitly rather than being interpreted through a convenient older layout. Runtime buffer and manifest source, v11.0.0
This is more than defensive parsing. If a parser silently loses its place, it can produce convincing-looking identifiers and timestamps that never existed. A diagram built from those values may look more authoritative than a visible exception, but it is less useful. Rejecting an unsupported format protects the analysis from fabricated precision.
The implementation is intentionally narrow. It supports the version represented by the included source snapshots and the event families needed for the experiment. It is not advertised as forward compatible with arbitrary future runtimes. The source snapshots have hashes, and the original trace remains available so a later decoder can revisit the interpretation.
The outer EventPipe extraction uses Microsoft.Diagnostics.Tracing.TraceEvent 3.1.23. That library reads the trace container and provides the raw event data. Our decoder interprets the async provider's nested buffer. Keeping these layers separate helps isolate whether a failure concerns the trace file, provider payload or higher-level reconstruction. TraceEvent package
A successfully collected file can still omit the story
The first recording completed successfully and the application printed checksum 5,050. The trace file existed and could be opened. Its application provider contained two hundred Begin and End markers. Those observations initially looked sufficient to proceed.
They were not. The async provider contributed one batch containing metadata. It did not contain the runtime transition records needed to explain the chain. A successful collector exit had established that a file was produced, not that this short-lived workload had delivered all the buffered information the investigation required.
The corrected subject explicitly requests a profiler flush after the measured workload. The selected command comes from the shipped provider source. This is a targeted request to the provider inside the laboratory's own process, not a scan or control operation against other applications.
double elapsed=Stopwatch.GetElapsedTime(begin).TotalMilliseconds;
// Flush this process's profiler buffers after the measured workload.
var profiler=EventSource.GetSources().FirstOrDefault(s=>s.Name=="System.Runtime.CompilerServices.AsyncProfilerEventSource");
bool flushed=profiler is not null&&profiler.IsEnabled();
if(flushed)EventSource.SendCommand(profiler!, (EventCommand)1, null);
The placement matters. The measured duration is captured before this flush, so the reported workload time does not include the explicit final buffer drain. The recording still has an observation cost while the workload is running, but this boundary prevents us from accidentally describing the final flush as part of each operation's work.
The original recording is retained as evidence of the failure mode. It is not overwritten or relabelled as a complete trace. The corrected recording uses the additional stage markers and the explicit flush; it is a different diagnostic capture and is described as such.
There is a useful general lesson here. Validate the information required for the next inference, not just the existence of the output file. For this experiment, the required information includes runtime transition records, nonempty call chains and ordered application markers. A checksum and a nonempty trace were necessary but insufficient.
Decode what was observed before explaining why
02 / A concrete example
Count the layer you are actually observing
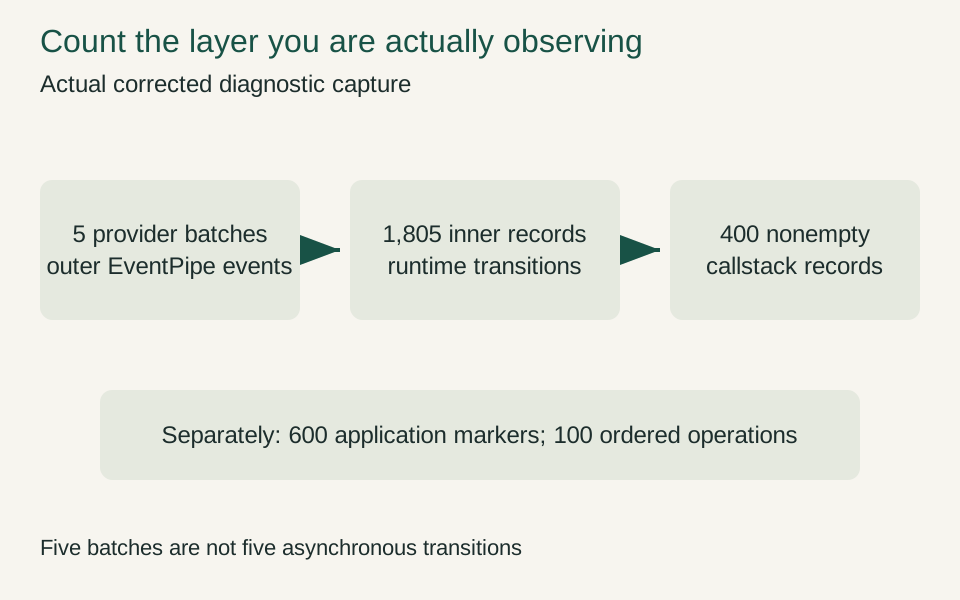
The extractor reads EventPipe events and the decoder reads nested records. Counting only the outer events would hide nearly all the observed transition activity.
Interpretation and evidence
- Validate each batch boundary.
- Use the emitted event manifest.
- Keep application counts separate.
The corrected diagnostic recording contains five async provider batches. The decoder reads 1,805 internal records from them. Separately, the application provider contains six hundred markers, and all one hundred per-operation stage sequences pass their order checks.
The internal records include one metadata record, four thread-context resets, one runtime context creation and one callstack creation. There are two hundred context resumes, two hundred callstack resumes, six hundred method resumes, one hundred ninety-nine callstack suspensions, one hundred ninety-nine context suspensions and four hundred method completions.
These counts describe this recording. They are not a universal formula for one hundred async operations. In particular, the enclosing Main continuation is still active when the subject requests the final flush. The file should not be treated as a complete history extending beyond the application's last observation point. We do not invent a missing final completion to make counts balance aesthetically.
Four hundred recorded callstack events contain at least one frame. The maximum frame count is five. That number includes an unresolved address in the selected example; it must not be presented as five confidently named application methods.
The EventPipe reader reports zero lost events. That is useful transport evidence, but it does not prove that every logically possible event exists in the file. Events outside the selected keyword family, records not emitted by the runtime and work beyond the flush boundary are separate questions. Zero reported loss is not a universal completeness certificate.
The diagnostic capture also shows that eighty-one operations have markers on more than one operating-system thread. This supports the narrow claim that those recorded operations crossed thread identities. It does not establish a throughput advantage, a required number of threads or a rule that every await must switch threads.
Recover names without pretending to recover everything
03 / A concrete example
An observed suspended logical chain
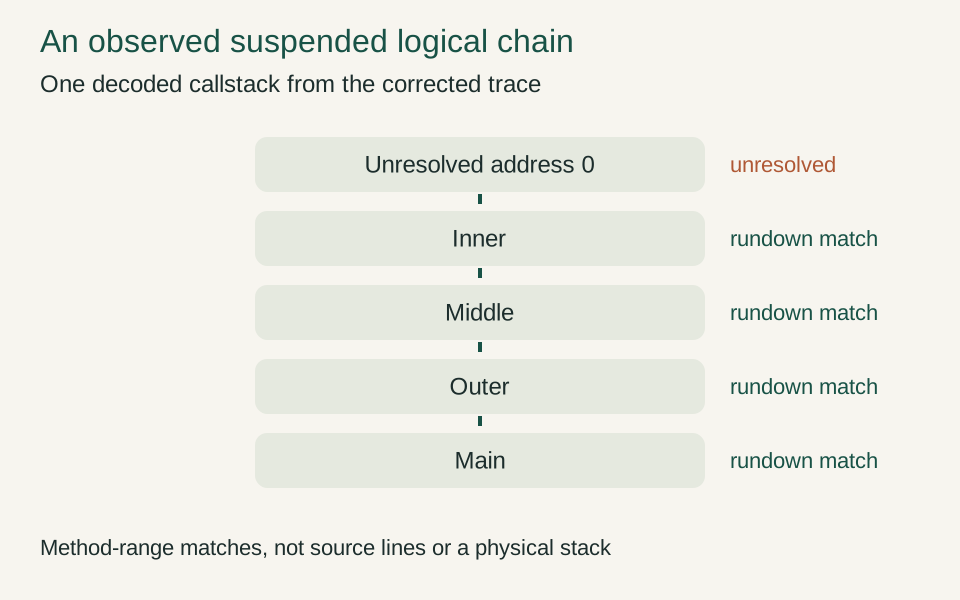
The method candidates come from address ranges in this same trace. Keeping the unresolved entry prevents the simplified picture from overstating symbolization.
Interpretation and evidence
- Preserve unresolved frames.
- Resolve within the same recording.
- Do not infer CPU cost from names.
Runtime-async callstack records contain diagnostic instruction addresses. For this event family, the first frame address is represented directly and subsequent addresses are represented through signed deltas. The decoder reconstructs the addresses before considering names. Runtime callstack capture source, v11.0.0
The same trace includes runtime rundown method information. The analyzer compares each reconstructed address with those method address ranges. When an address falls inside a range, it records the method name as a candidate. This is a local association within one recording, not an external symbol-server lookup or source-line mapping.
One initial callstack produces candidate names corresponding to Middle, Outer and Main. A later suspended chain contains an unresolved zero address followed by Inner, Middle, Outer and Main. The generated names in the raw report retain the compiler's spelling; the prose uses the source-level names only where the correspondence is evident.
That unresolved address remains visible. Deleting it would make the diagram cleaner while silently changing the evidence. Giving it an invented framework-method name would be worse. The figure labels it unresolved and leaves the included raw address and candidate list available for inspection.
This method also has boundaries beyond the zero address. Multiple ranges can potentially create ambiguity, and missing rundown information can leave otherwise valid addresses without names. The analyzer stores candidate lists instead of asserting that every address has exactly one definitive symbol. It does not claim line numbers, inlined call information or a complete physical stack.
The recovered logical chain answers a useful question: which suspended application calls are represented in this runtime continuation record? It does not answer which method consumed the most processor time. Names make a relationship understandable; they do not supply a missing measurement dimension.
Keep application identity separate from runtime identity
04 / Watch the mechanism
The operation can outlive its thread segment
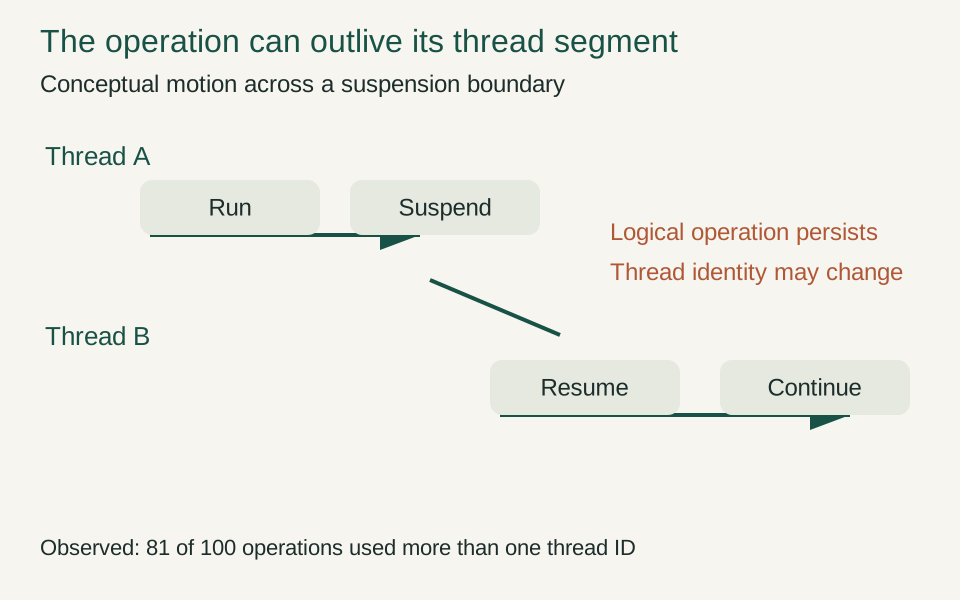
Static view. Play to see how the mechanism unfolds.
Motion illustrates a possible thread transition, not the duration of a specific operation. The diagnostic marker evidence independently records thread changes for 81 operations.
Interpretation and evidence
- An await need not switch threads.
- One thread is not one operation.
- Keep application and runtime IDs distinct.
The application labels its operations from zero through ninety-nine. The async profiler supplies dispatcher identifiers and thread-context identifiers. These identifiers belong to different layers, even when they happen to be small integers.
It would be tempting to join operation 1 to dispatcher 1 and draw a complete request timeline. That would be an unsupported association. In this sequential program, one continuation context can span more than one application operation. An identifier's numeric resemblance to another identifier says nothing about ownership.
The analyzer therefore maintains two views. Application markers are grouped by the explicitly emitted operation value and checked for the expected stage order. Runtime records are interpreted using their own identifiers, timestamps and frame data. The article compares the views where the evidence permits, without pretending that an automatic per-request join has been implemented.
For a production investigation, this distinction suggests a design requirement rather than a missing cosmetic feature. Decide how application operations will be correlated with lower-level diagnostics. A meaningful trace context or explicit marker contract can be more valuable than collecting another large volume of unlabeled events.
Correlation also needs a time model. A provider batch is delivered after the records inside it were generated. Assigning every nested record the outer event's delivery timestamp would collapse a history into one instant. The decoder uses the batch's internal timestamp data and retains application marker times separately. It does not equate arrival order with execution order across all threads.
These choices keep the current analysis honest and make the next extension clearer. A future tool could build a richer cross-layer model, but it would need a documented correlation rule, clock handling and validation cases. It should not inherit an accidental equality between two unrelated integer fields.
Measure the observer with an explicit boundary
05 / A concrete example
Observe the cost without inventing precision
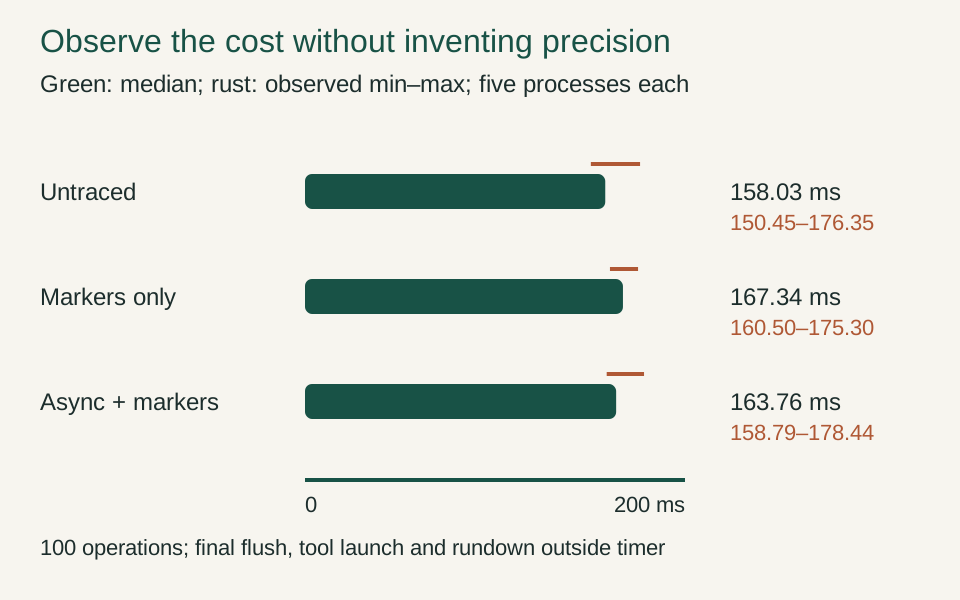
The bars describe this short workload lifecycle on one host. Their ranges preserve variation and do not establish a general overhead percentage.
Interpretation and evidence
- Same checksum in all runs.
- Five samples are not a service percentile.
- Final drain cost is excluded.
The observation-cost experiment runs the identical subject in three modes: without a collector, with application markers collected, and with both application markers and the selected async profiler events collected. The code and checksum remain the same. Each mode receives five fresh processes, with the order reversed in alternating rounds.
The timer is inside the subject. It covers the one hundred operations, including their marker calls and asynchronous waits. It does not include launching dotnet-trace, waiting for the tool to attach, the explicit final flush, trace rundown or writing the final console report. Those excluded costs still exist; they simply belong to a different boundary.
This is a short-lived workload comparison rather than a warmed steady-state benchmark. JIT work, initialization, scheduler variation and timer behavior can influence the observations. Fresh processes improve isolation between runs but do not magically remove those costs. They define the lifecycle being measured.
The fifteen processes all completed with checksum 5,050. These are the recorded workload durations, rounded only for presentation:
| Mode | Median workload ms | Observed min–max ms | Samples |
|---|---|---|---|
| No collector | 158.03 | 150.45–176.35 | 5 |
| Application markers only | 167.34 | 160.50–175.30 | 5 |
| Async profiler and markers | 163.76 | 158.79–178.44 | 5 |
The ranges overlap substantially. The full-profiler median is below the marker-only median, even though enabling another provider is not a mechanism for making this computation cheaper. That ordering is a warning against extracting an incremental overhead percentage from these small, noisy groups.
Subtracting the medians would produce a number, but the number would not isolate the provider's causal cost. Each process can encounter different scheduling delays, and this workload intentionally spends time waiting. The observed variation is large enough that a small overhead can be concealed or exaggerated. No claim of negative overhead, a production speedup or negligible overhead is warranted.
The marker-only trace files range from 564,326 to 566,206 bytes. The async-plus-marker files range from 604,382 to 605,578 bytes. These are complete file sizes, including rundown and other trace content, rather than a pure size measurement of the internal async records. Their difference should not be relabelled as a precise per-operation storage cost.
The useful conclusion is operationally modest. This bounded experiment successfully records and decodes the requested relationships while preserving the computation's result. It does not resolve a small timing-overhead estimate. A stronger cost study would need an appropriate longer-running workload, repeated independent groups and a timer boundary matching the deployment decision.
The marker-only mode matters because enabling application events can itself change the work performed. Comparing full tracing only with an unobserved run would combine that cost with the async provider's cost. The three-mode design does not isolate every internal component, but it prevents one obvious source of attribution error.
The profiler mode also produces a trace file whose size can differ across runs. File size is useful operational information, not a direct measurement of CPU overhead or total memory consumption. Buffers, compression, rundown content and emitted events all affect what is eventually written.
Five observations are enough to expose the scale and variability of this local experiment. They are not enough to justify a general overhead percentage for a service, and they certainly do not establish a sub-one-percent guarantee. A credible operational decision would repeat the experiment against the workload, duration and diagnostic configuration that the service will actually use.
Choose the missing observation before adding more events
If the unresolved question is why a continuation consumes CPU, adding more logical-chain events is not necessarily the answer. A CPU sampling profile would supply another kind of evidence. If the question is why work waits, scheduling, contention or dependency timing may matter more. Instrumentation should follow the question rather than the appeal of a comprehensive-looking trace.
The collection command launches only the laboratory's own child process and uses a sixteen-megabyte EventPipe buffer. The wrapper imposes a thirty-second timeout and terminates its own process tree if that bound is exceeded. It does not enumerate or attach to unrelated applications. The documented child-launch and buffer controls are the mechanisms used here. dotnet-trace documentation
Buffer size is another trade, not a completeness switch. A larger buffer may tolerate bursts but consumes more memory. A smaller event selection may reduce diagnostic detail while making the recording easier to sustain. The experiment records its selected provider mask so another reader can distinguish an intentionally omitted event family from a decoder failure.
There is also a difference between a diagnostic recording and a permanent production setting. A bounded trace can answer a focused question without being an appropriate always-on configuration. The current experiment provides no retention policy, production data classification or long-duration resource measurements. Those concerns should be resolved using the real environment rather than inferred from a short local run.
The right next step depends on the remaining uncertainty. If method candidates are missing, investigate mapping evidence. If application ownership is ambiguous, improve correlation. If CPU attribution is absent, collect CPU observations. Repeating the same trace with more events cannot substitute for naming the dimension that is missing.
A chain diagnosis can be correct while a performance diagnosis is wrong
Consider a hypothetical extension in which Inner waits for a remote dependency instead of a local timer. A recovered chain could correctly show that Outer remains logically dependent on Inner. It would still be wrong to conclude that Inner is consuming the request's elapsed time as CPU work. The chain identifies responsibility for a continuation, not the resource responsible for delay.
Now consider a different extension: after the wait completes, Middle performs an expensive synchronous transformation. The same high-level chain may remain visible, but a CPU investigation should focus on the transformation. A diagram that highlights only the deepest awaited method could direct attention away from the actual processor work.
These are proposed scenarios, not additional experiments performed for this article. They explain why the original recording is useful without being sufficient for every diagnosis. The missing dimension determines the next instrument. Dependency timings, CPU samples, allocation measurements and queue evidence each answer different questions about an otherwise similar-looking logical chain.
The same reasoning applies to the eighty-one observed thread changes. They establish that application operations crossed thread identities in this run. They do not identify excessive scheduling as a bottleneck. Removing a thread transition would be an optimization only if it preserved semantics and improved a relevant outcome under the actual workload.
A practical investigation should therefore end each interpretation with a falsifiable statement. “This continuation includes Middle and Outer” can be checked against the decoded record and method candidates. “Middle dominates CPU” requires CPU evidence that this trace does not contain. “The added provider costs less than one percent” requires a cost experiment capable of resolving that difference. Keeping the statements separate prevents the strongest evidence from lending unearned authority to the weakest claim.
That discipline also makes collaboration easier. A developer can share the exact record supporting a chain relationship without requiring a colleague to accept an entire performance story. The next investigator can add the missing observation instead of repeating the whole exercise or arguing about an ambiguous screenshot.
Treat the decoder as executable reasoning
The decoder's checks are not an ornamental test suite around a preferred conclusion. Each one protects a particular inference. Length checks prevent reading outside a record. Declared-count checks prevent silently skipping the tail of a batch. Marker-order checks protect the application timeline. Preserving unresolved addresses protects the distinction between data and interpretation.
The bundle includes the original short capture, the corrected diagnostic capture, extracted payloads, decoded records and source hashes. That allows a reader to inspect an inconvenient observation rather than taking the article's selected examples on trust. The runnable collector and analyzer make the path from bytes to explanation explicit.
There are deliberate limits. The parser does not reconstruct arbitrary nested request ownership, does not symbolize source lines and does not promise compatibility with a later runtime's internal event schema. The workload does not test cancellation, exceptions, parallel operations or a mixed population of compiler-generated forms. Those are meaningful future cases, not implied successes.
The strongest result is consequently narrower than a polished profiler screenshot might suggest. In an actual .NET 11 runtime-async workload, the captured records reveal logical continuation chains that survive thread changes. We can validate their encoding, identify several method candidates and compare the cost of selected observation modes. We cannot derive a CPU profile or a production overhead guarantee from those facts.
That narrower result is still valuable. It changes how to read an async trace: first establish which story the recording contains, then distinguish runtime relationships from application identity, and only then attach a performance explanation. The goal is not to make every stack picture look complete. It is to know which question each picture can honestly answer.
Source code and execution evidence
Download the complete lab, source record and raw execution results. This package supports the specific execution claims in this article. It is not a production certification.