Follow the Agent Tool to the Rows the Database Actually Reads
A real framework tool reaches SQL Server, where two Index Seek plans return the same answer while reading different amounts of data.
Explore the mechanism ↓
Reading tools Listen or translate
Read aloud
Uses an installed voice on your device.
Translate article
Machine translation. Code and evidence notes stay in English.
Original English text.
START WITH THE MECHANISM
Interactive companion and laboratory update: 12 November 2026. The editorial date places the topic on the timeline; this current explanation and its measured evidence retain their actual preparation and execution dates.
THE FULL INVESTIGATION
Follow the Agent Tool to the Rows the Database Actually Reads
Dates and technology context
This is a retrospective editorial timeline. Topic context: 1 October 2026. First publicly available: 12 November 2026. Current text, visuals and laboratory revisions were prepared on 12 November 2026.
The actual Agent Framework1.28.0/MEAI11/.NET11 invocation, SQL plans, 1,000/5,000 rows, 6/17 reads and timer observations remain 2026-11-12 evidence. Any earlier pre-GA placement would require a genuine preview-specific rewrite and pinned source, not just a date edit.
An agent answers a question slowly. The trace contains a tool call, the tool contains a SQL query, and the query returns one aggregate row. It is tempting to call this model latency, tool overhead or a database problem depending on which dashboard someone opened first. Each explanation can be plausible while describing a different interval.
The useful investigation follows the operation across its actual boundaries. What work belongs to the agent run? What happens while a connection is opened and its identity established? What does the command timer include? How much source data does the database examine before returning the tiny result? Without those distinctions, a correct optimization can be hidden by an unrelated lifecycle cost.
This article uses an executed Microsoft Agent Framework tool invocation against a real SQL Server 2022 database. The provider is a deterministic scripted IChatClient, not a language model. That removes inference quality and remote model service time from the experiment while preserving the framework's actual function-call protocol and application tool boundary.
The two approved SQL shapes return the same count and sum. Both actual plans contain an Index Seek. One reads one thousand rows, while the other reads five thousand. Their diagnostic logical reads are six and seventeen. That result is the center of the article: a tool response and an operator name are not sufficient descriptions of the work that produced them.
Start with the operation contract, not the slowest-looking span
The fixture contains ten thousand orders. For identifier i, the tenant is i modulo two, the region is i modulo ten and the amount is i modulo one hundred plus one. The approved application scope is tenant one. Asking for region three therefore selects one thousand rows with an amount sum of 49,000.
The expected result is calculated independently in C# from the generator's rule. It is not obtained by asking one SQL query to certify the other. Both approved query shapes must return the same count and sum before their plans or timings are interpreted.
The database exposes a tenant-one view that filters the base table to the approved scope. The tool's query accesses that view rather than accepting a table name from a proposal. A covering index on Tenant and Region includes Amount. That index is part of the experiment's input, not a property that can be assumed for every query an agent might generate.
The result is deliberately small. It contains two scalar values, not an arbitrary export of order records. That makes output correctness easy to inspect and keeps the experiment bounded. It also demonstrates why a one-row tool response can hide substantially different database work.
The test does not measure a deployed API, a model endpoint or a production workload. It executes a local C# agent adapter and a local disposable SQL Server container. The relevant end-to-end boundary is the recorded agent run, with its selected tool and database operation. Expanding that boundary requires additional evidence rather than a broader label on the same stopwatch.
All execution took place on 12 November 2026 with SDK 11.0.100, runtime 11.0.0, Microsoft.Agents.AI 1.28.0, Microsoft.Extensions.AI 11.0.0 and Microsoft.Data.SqlClient 5.1.6. SQL Server reported build 16.0.4315.2 and compatibility level 160. These are actual version pins, not inferred compatibility claims.
Keep the framework real while making the provider deterministic
01 / Watch the mechanism
Follow the real tool boundary
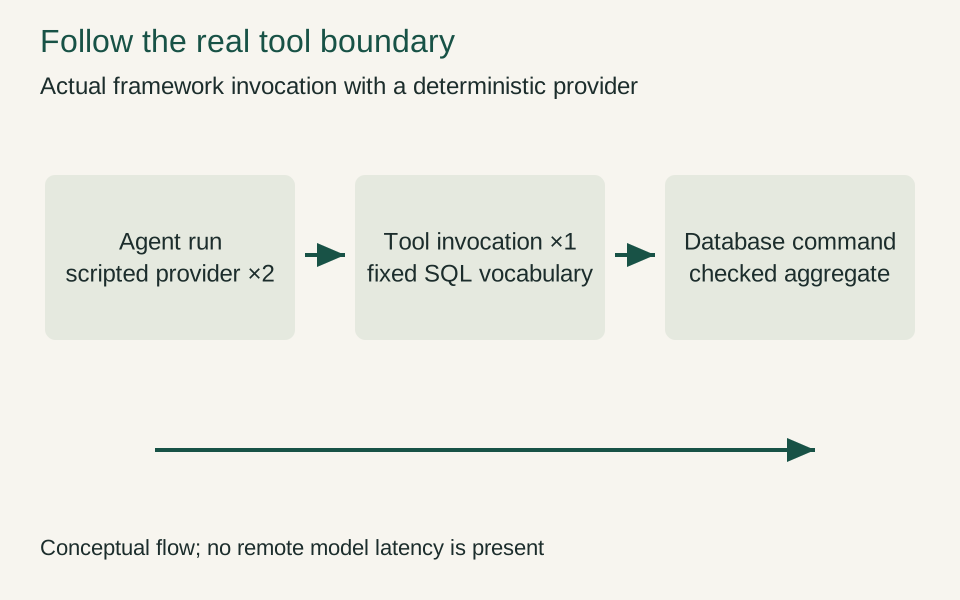
Static view. Play to see how the mechanism unfolds.
Two provider calls surround one actual tool invocation. The marker illustrates causality, not the duration of model inference.
Interpretation and evidence
- Real framework, scripted provider.
- One tool call per proposal.
- Check the authoritative result.
The scripted provider implements IChatClient. On its first response, it emits a FunctionCallContent requesting query_orders with a known typed proposal. After it receives a FunctionResultContent, it returns a fixed acknowledgement. It does not generate SQL or infer the meaning of the supplied English question.
The function call passes through FunctionInvokingChatClient and ChatClientAgent. The tool is created with AIFunctionFactory and calls the actual database adapter. Every scenario checks that the provider was invoked twice and the tool exactly once. The protocol boundary is therefore exercised rather than replaced with a direct call that merely looks like an agent in the article.
Microsoft.Extensions.AI provides the IChatClient abstraction and function-invocation middleware used here. Microsoft.Agents.AI supplies the agent layer. The package versions are pinned and the executed project preserves its dependency lock. Microsoft.Extensions.AI 11.0.0, Microsoft.Agents.AI 1.28.0
This arrangement is useful for one specific reason: it makes the tool and SQL boundaries reproducible without attributing variability to a model that was never called. It does not evaluate natural-language understanding, reasoning quality, prompt robustness or the probability of a real model choosing the correct tool.
The fixture question is paired with a predetermined proposal. That pairing belongs to the test input. A production agent would need a separate evaluation of the proposal-producing stage. The current article focuses on what happens after a proposal reaches the application-controlled tool boundary.
The distinction also prevents an unfair performance claim. A fast scripted provider is not evidence that an equivalent real model will be fast. The measured framework path includes local dispatch and tool handling, while excluding remote inference entirely. The result can explain the local pipeline without pretending to benchmark AI service latency.
Put the SQL vocabulary under application ownership
The tool accepts a QueryPlan containing a template key, tenant, region and an optional SQL field used only to demonstrate rejection. Any nonempty SQL field is refused before a database connection is opened. Unknown template keys, another tenant and unsupported region values are also rejected.
The approved template dictionary contains two fixed SQL statements. The first compares the integer Region column with an integer parameter. The second is a controlled comparison variant that converts Region to text and compares it with a character parameter. Both statements are authored in the application source and selected by a known key.
The normal query is:
SELECT COUNT_BIG(*) AS N,
       COALESCE(SUM(CAST(Amount AS bigint)),0) AS Total
FROM dbo.Tenant1Orders
WHERE Region=@region
OPTION(MAXDOP 1);
The comparison variant changes the predicate representation:
SELECT COUNT_BIG(*) AS N,
       COALESCE(SUM(CAST(Amount AS bigint)),0) AS Total
FROM dbo.Tenant1Orders
WHERE CONVERT(varchar(12),Region)=@regionText
OPTION(MAXDOP 1);
Neither statement is assembled from untrusted SQL syntax. Values are supplied through explicitly typed SqlParameter instances. The comparison variant exists to expose a plan difference, not to provide a general text-generation escape hatch.
This design separates two concerns that are often mixed. The agent may propose intent, but the application owns the executable vocabulary. The database still enforces permissions independently. A safe template key is not a substitute for a restricted database identity, and a restricted identity is not a reason to execute arbitrary model text.
Follow three timer boundaries through one call
02 / See the idea
Name the timer before comparing the time
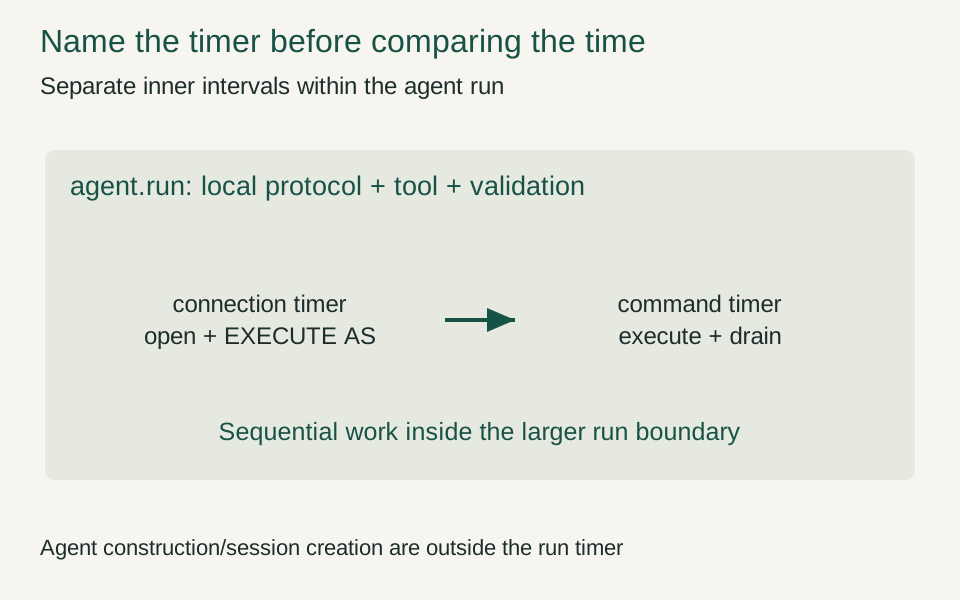
A shorter command can be hidden by connection lifecycle cost. The diagram separates the measured intervals rather than inventing one universal overhead.
Interpretation and evidence
- Connection setup is visible.
- Pooling is disabled in this fixture.
- Do not subtract unrelated medians causally.
The agent-run timer begins immediately before RunAsync and ends after the framework receives the scripted provider's final response. Agent construction and session creation occur before that timer. The provider's fixed function-call response, function invocation and result round trip occur inside it.
The connection timer belongs to the database adapter. It includes opening a new SQL connection and switching to the AgentReader database user. Pooling is disabled deliberately, so this boundary does not represent a warmed pooled connection checkout. That choice keeps each restricted session isolated and makes the connection cost visible.
The SQL-command timer begins before ExecuteReaderAsync and ends after all result sets have been drained. It includes the local client/server exchange and result materialization. It excludes connection opening, execution-context setup and the independent expected-result calculation performed afterward.
These intervals are related but not identical. The agent-run interval contains the tool's connection and command work, along with local protocol overhead and validation. The command interval does not measure the complete user-visible operation. Subtracting independently collected values without respecting their placement can produce a misleading residual called framework overhead.
The laboratory also creates application Activity spans for agent.run, scripted.provider, tool.query_orders and sql.command. A local ActivityListener records their trace IDs, span IDs, parent IDs and durations. This is actual BCL activity evidence, not an exported production tracing deployment.
The trace is intentionally small. It can show the call relationship and the selected instrumentation boundaries. It does not contain every runtime wait, network packet or SQL engine internal event. The actual execution plan and STATISTICS IO provide a separate view of database work that the application spans alone cannot explain.
Capture the plan in a diagnostic run, not inside the timing claim
The diagnostic path enables STATISTICS XML and STATISTICS IO on the restricted connection, executes the approved query and drains the result sets. The aggregate row and XML plan arrive as different results. The adapter saves the plan and informational messages before closing the session.
STATISTICS XML executes the statement and returns information about the actual execution. It also requires appropriate query permissions and SHOWPLAN permission. The fixture grants SHOWPLAN deliberately to its restricted diagnostic user and documents that additional metadata visibility. Microsoft: SET STATISTICS XML
The timing loop does not enable these diagnostic settings. It uses the same templates and parameter values but avoids including plan collection in the reported command timings. This does not make the diagnostics unrelated; it makes the observation cost and the timing boundary explicit.
The parser retains missing runtime counters as null rather than inventing zero work. Some Compute Scalar nodes do not have their own reported runtime count. Their absence is not proof that scalar evaluation did not happen. The interpretation focuses on access operators with the relevant recorded counters.
The database contains ten thousand base rows, split evenly between the two tenant values. The approved tenant view exposes five thousand. That distinction matters when the text-conversion variant reads five thousand rows: it is reading the approved tenant range, not necessarily scanning every row in the base table.
A plan screenshot or a single operator label would make it easy to miss that boundary. The raw XML, view definition, index definition and independent result are therefore kept together. The explanation should be traceable to the structure the engine actually used.
Two seeks can perform different amounts of work
03 / A concrete example
Two seeks, different source work
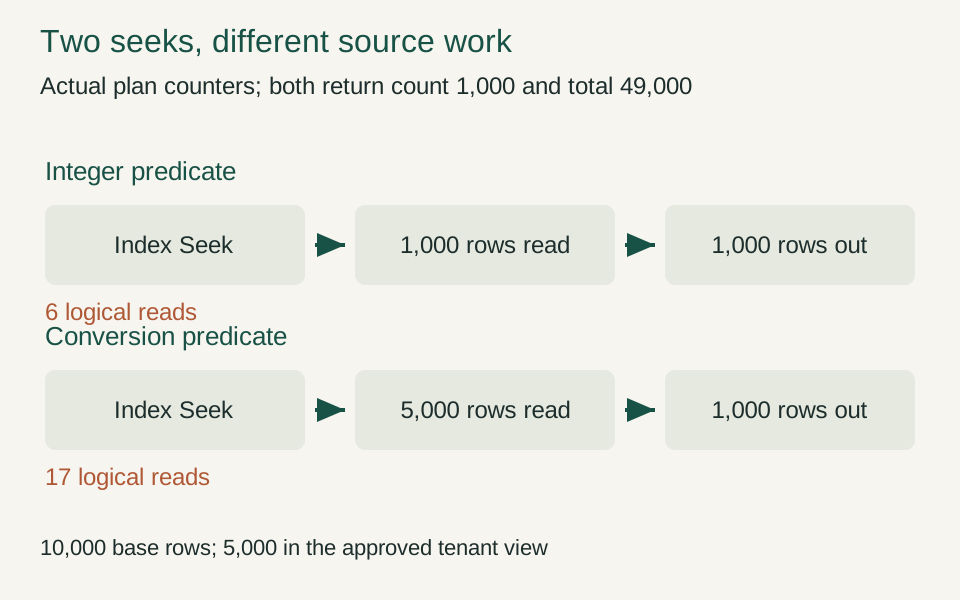
The operator name alone hides the difference. The saved runtime counters and I/O messages make the actual access work visible.
Interpretation and evidence
- Read rows examined, not only returned.
- Seek is not a performance certificate.
- Keep the same result contract.
The direct integer predicate's access operator is an Index Seek with one thousand rows read and one thousand rows produced. The aggregate produces one result row containing count 1000 and total 49,000. STATISTICS IO reports six logical reads and zero physical reads in the diagnostic capture.
The text-conversion variant also contains an Index Seek. Its access operator reads five thousand rows but produces the same one thousand qualifying rows. The aggregate returns the same result, and the diagnostic logical-read count is seventeen, again with zero physical reads.
The important difference is therefore not seek versus scan. It is the amount of source work performed within the selected access path. The index can still be useful for the tenant prefix while the remaining predicate requires examining more rows. The saved plan supports that narrower explanation without a universal rule about every conversion expression.
The estimated row count differs as well. The direct query estimates one thousand at its access operator; the conversion variant estimates approximately 707.107 while producing one thousand. The experiment changes predicate representation and access behavior together, so it does not isolate estimation accuracy as the sole cause of any timing difference.
Logical reads are page accesses from the data cache, not bytes returned to the tool and not proof of disk I/O. The zero physical-read observations do not make either query free. They simply describe the captured executions. Microsoft: SET STATISTICS IO
This is a useful counterexample to an overly simple diagnostic agent. A rule saying that Index Seek means the database is efficient would accept both plans without noticing the fivefold difference in rows examined. A better explanation asks which predicates constrain the access and how much work survives beneath the same operator name.
Let the result reject the attractive hypothesis
05 / See the idea
Make an explanation face the evidence
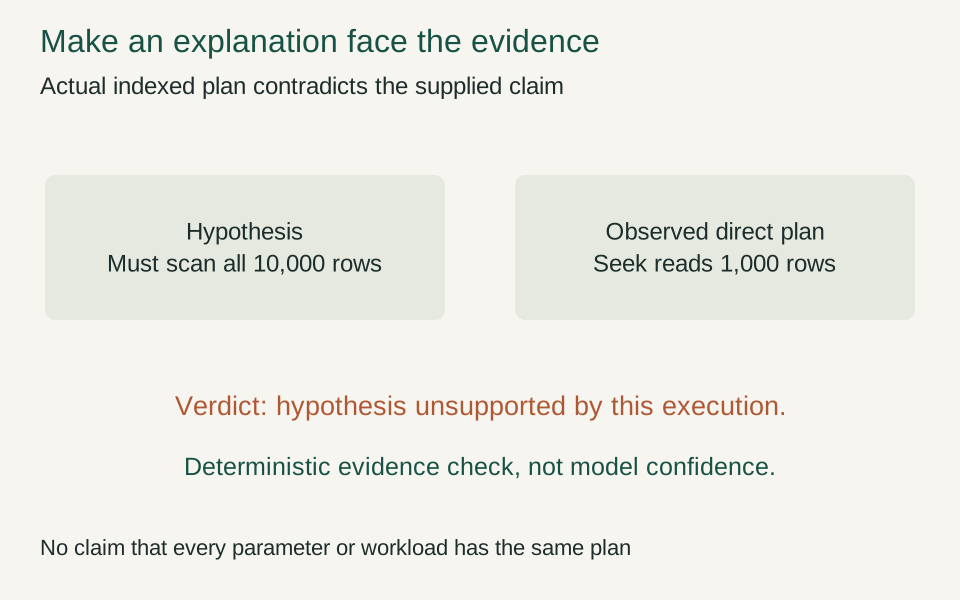
The application compares the claim with saved plan evidence. It does not ask a scripted provider to manufacture confidence.
Interpretation and evidence
- Separate claim and observation.
- Keep a falsifying condition.
- Scope the conclusion to the fixture.
The fixture includes a deliberately incorrect claim: the indexed region summary must scan the entire base table. The actual direct plan contradicts that statement. It contains the approved index seek and reports one thousand source rows read, not ten thousand.
The claim is rejected by a deterministic evidence check, not by a language model's confidence. The scripted provider does not judge plans. The application parses actual XML and requires the relevant operator evidence before recording the hypothesis as unsupported.
This separation is useful when building a diagnostic assistant. A model can propose explanations, but a proposal should not become a fact merely because it is phrased fluently. The evidence layer should retain what was observed, what was inferred and which conditions would falsify the explanation.
The conversion variant provides another discipline check. Its Index Seek does not support the claim that it examines only the final thousand rows. The actual rows-read counter is five thousand. A diagnostic system that uses only operator names would miss this contradiction even if it correctly identified the index.
The experiment does not prove that the direct template is optimal for every parameter distribution or result shape. It proves that, for this fixture and region, the direct predicate uses fewer source-row and page accesses while preserving the result. A different tenant distribution, missing covering column or broader query could change the plan.
Keeping the claim narrow makes it actionable. The tool owner can inspect the selected template and its access pattern. The team does not need to blame the model, replace the framework or tune every database setting before addressing the concrete query representation under test.
Read the measured pipeline table in the correct units
04 / A concrete example
Timing does not isolate a universal agent cost
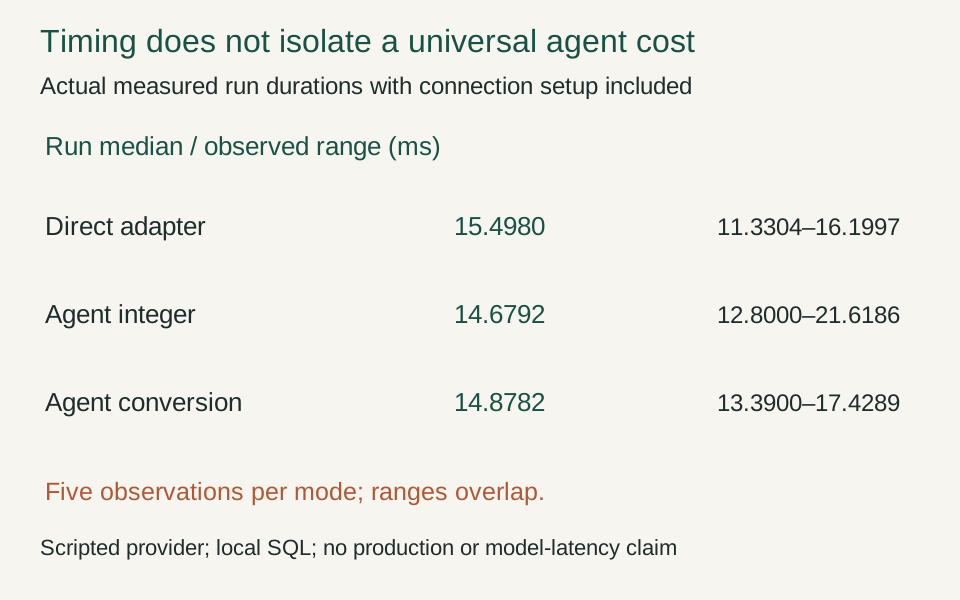
The direct median being above the agent median is not evidence of negative framework overhead. The small sample preserves variability instead of hiding it.
Interpretation and evidence
- Keep ranges visible.
- Name excluded inference work.
- Do not infer causality from median subtraction.
The dedicated measured run contains five observations for each mode, with alternating order across rounds. The table reports medians and observed ranges, rounded for presentation:
| Mode | Run median ms | Run min–max ms | Connection median ms | SQL-command median ms |
|---|---|---|---|---|
| Direct adapter | 15.4980 | 11.3304–16.1997 | 12.0984 | 1.0091 |
| Agent, integer predicate | 14.6792 | 12.8000–21.6186 | 13.1762 | 1.1498 |
| Agent, conversion predicate | 14.8782 | 13.3900–17.4289 | 12.0839 | 1.8770 |
The direct adapter's median is higher than the agent-index median in this small sample. That does not mean the framework makes the database faster. The ranges overlap, and the connection lifecycle varies enough to obscure a small local dispatch cost. Subtracting these medians would not isolate framework overhead.
The conversion template has a larger median command duration in this run, consistent with its additional rows-read and logical-read work. Yet the end-to-end medians remain close because command execution is only one part of the selected lifecycle. The evidence supports discussing the query mechanism without promising a matching percentage reduction in the complete operation.
The direct mode calls the approved SQL adapter without the agent protocol. The agent-index mode uses the real framework and the direct integer template. The agent-cast mode uses the same framework with the conversion comparison template. All measured calls return count 1000 and total 49,000.
Five observations per mode are a small local comparison. They do not establish service percentiles, stable model overhead or production capacity. The provider is deterministic and remote inference is absent. The SQL container is capped at two CPUs and four GiB, and each query specifies MAXDOP 1.
Connection setup can dominate a small command in this fixture because pooling is disabled. That is not a recommendation to disable pooling in a production service. It is an explicit lifecycle choice for isolated impersonated sessions. A production timing study should use its actual connection-management policy and name that boundary.
The query's source-work difference can remain meaningful even when elapsed time varies. Conversely, a lower elapsed time in one small sample cannot erase the actual rows-read evidence. The timer and plan describe different aspects of the same operation; neither should be forced to validate an exaggerated claim from the other.
The table therefore preserves medians and observed ranges rather than selecting only the fastest execution. The raw observations retain connection, command and end-to-end values separately. A reviewer can see whether the interpretation depends on a stable mechanism or on a convenient local fluctuation.
Keep permission and performance evidence connected
Every approved query runs after EXECUTE AS USER switches the connection to AgentReader with NO REVERT. The user has SELECT on the tenant-one and diagnostic-summary views and SHOWPLAN for the diagnostic capture. It has no granted update, drop or direct base-table access.
The harness verifies the effective user name and tests denied UPDATE, DROP, other-tenant view access and direct base-table access. The database rejects those fixed negative statements. A later administrative check confirms that the table and its aggregate remain unchanged.
The administrative connection used to create the fixture is part of the trusted laboratory host. The test does not claim that credentials are separated into another process or that an untrusted model can execute arbitrary code inside this host. The tool's SQL vocabulary is fixed, and the effective database context provides an independently tested restriction on those operations.
This matters for performance work because diagnostics can expand authority. Granting SHOWPLAN is a deliberate choice, not an incidental consequence of read-only data access. A production system should consider which metadata the diagnostic identity can reveal and whether that visibility matches its approved scope.
The current diagnostic view exposes only a known object label and row count across the fixture. It does not expose another tenant's order records or amounts. That approved summary is a different permission from access to the tenant-two view, which is explicitly denied.
A useful diagnostic agent should preserve these distinctions in its evidence. It should not turn a performance hypothesis into permission to inspect unrelated data, and it should not describe a failed permission check as proof that the query has no performance issue. Correctness, authority and cost remain separate acceptance dimensions.
Preserve trace structure when optimizing the implementation
An optimization can change the instrumentation boundary as well as the implementation. Moving connection acquisition outside a tool method, caching a prepared result or sharing a provider session can make a span shorter without reducing the full operation's work. A useful comparison keeps the externally meaningful boundary stable and explains any newly excluded work.
The fixture records span identity and parent identity, so the tool and command can be followed within an agent run. The provider produces two separate observations around the function result. Those events are local application instrumentation, not a guarantee that a production exporter or backend would retain the same complete trace under sampling.
The trace also makes rejected proposals interesting. They still pass through the agent and tool boundary, but they should not create a SQL command span because validation ends the operation before database access. That absence has meaning only when paired with the explicit rejection result and execution counter. Missing telemetry alone would be a weaker basis for concluding that no query ran.
For a production adaptation, define which spans are required to support the diagnostic question and what missingness means. A sampled SQL span cannot prove that the query never happened. A lost export can make a correct tool look uninstrumented. Application state, command receipts and telemetry have different reliability responsibilities.
The same care applies to names. Stable span names such as tool.query_orders and sql.command make aggregation possible without putting arbitrary questions or customer values into the name. The fixture uses controlled inputs, but the instrumentation pattern should not turn a real user's question into uncontrolled high-cardinality telemetry.
The goal is not to maximize the number of spans. It is to preserve a clear explanation of where the operation crossed a boundary and which work belongs to each interval. That explanation should survive a query optimization without silently changing what the reported duration means.
Optimize the boundary that the evidence identifies
The strongest result is concrete. A real agent function call reaches a fixed SQL tool; the tool executes under a restricted database context; two approved templates return the same aggregate; and their actual plans examine different amounts of data despite sharing the Index Seek label.
The next optimization depends on the observed boundary. If connection setup dominates the intended workload, investigate connection lifecycle. If the query examines unnecessary rows, investigate predicate representation, indexing and coverage. If a real model later dominates the full operation, evaluate that provider separately rather than projecting the scripted fixture's timing onto it.
The experiment does not justify changing all of those dimensions at once. A coherent change keeps the operation contract stable and tests the mechanism it intends to improve. Otherwise a faster result may come from a different tenant scope, omitted validation or a narrower output rather than a better implementation of the same task.
The evidence should also determine when to stop investigating. Once the actual plan, result oracle and timing boundary explain the selected difference, collecting unrelated counters does not automatically improve the decision. The next measurement should answer a remaining question that could change the repair, not merely make the report longer.
The raw source, plans, traces, permission receipts and measurements make that contract inspectable. The diagrams simplify the flow, but the evidence remains available for the parts where a simplified picture can mislead.
An agent tool is not a black box merely because a model can call it. It is application code with lifetimes, permissions, queries and measurable work. Following those responsibilities to the rows actually read is often more useful than debating whether the slow operation belongs to AI or to the database.
Source code and execution evidence
Download the complete lab, source record and raw execution results. This package supports the specific execution claims in this article. It is not a production certification.